
100+ Clients In The UAE & Around The World
Business Intelligence, Analytics & Data Engineering
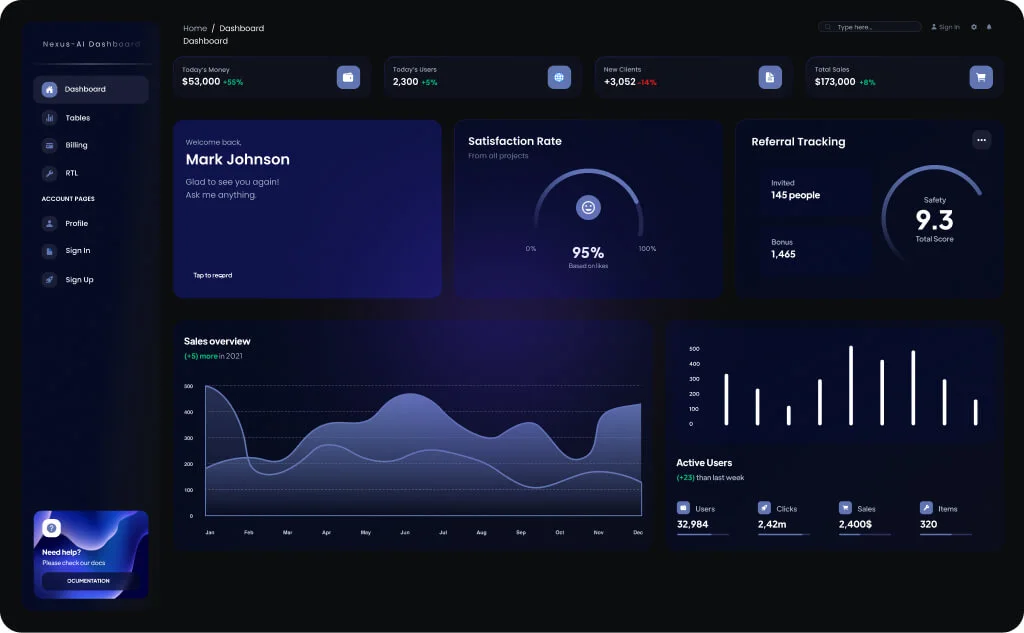
Most businesses are sitting on more data than they know what to do with. We help make sense of it using Power BI, Tableau, and Alteryx to build dashboards and reports that actually reflect how your business operates, all tailored to your unique data ecosystem and requirements.
That means real time visibility into the numbers that matter, automated reporting that doesn’t require someone to manually pull it together each week, and a data structure built to be scalable.
Ready to unlock the full potential of your data? Get in touch with us today !
Transform Your Data into Actionable Intelligence with Power BI, Tableau & Alteryx
Uncover the answers to critical business questions, from what happened, to why and when it happened to leverage and capitalize on emerging trends

Trusted by the leading brands


About US


Recognized as a Dubai Al Seal Enterprise
Aleddo is officially recognized by the Government of Dubai with the Dubai Al Seal, by the Dubai centre for artificial intelligence (DCAI), and the Dubai Future Foundation.
This is a testament to our consistent delivery of impactful AI solutions and our proven track record of driving measurable change in both the government and private sectors.
No two businesses run the same way, and the BI solutions we build reflect that. We work with your data, your processes, and your reporting needs, so the output is something your team actually uses to make decisions, not just something that is generic.
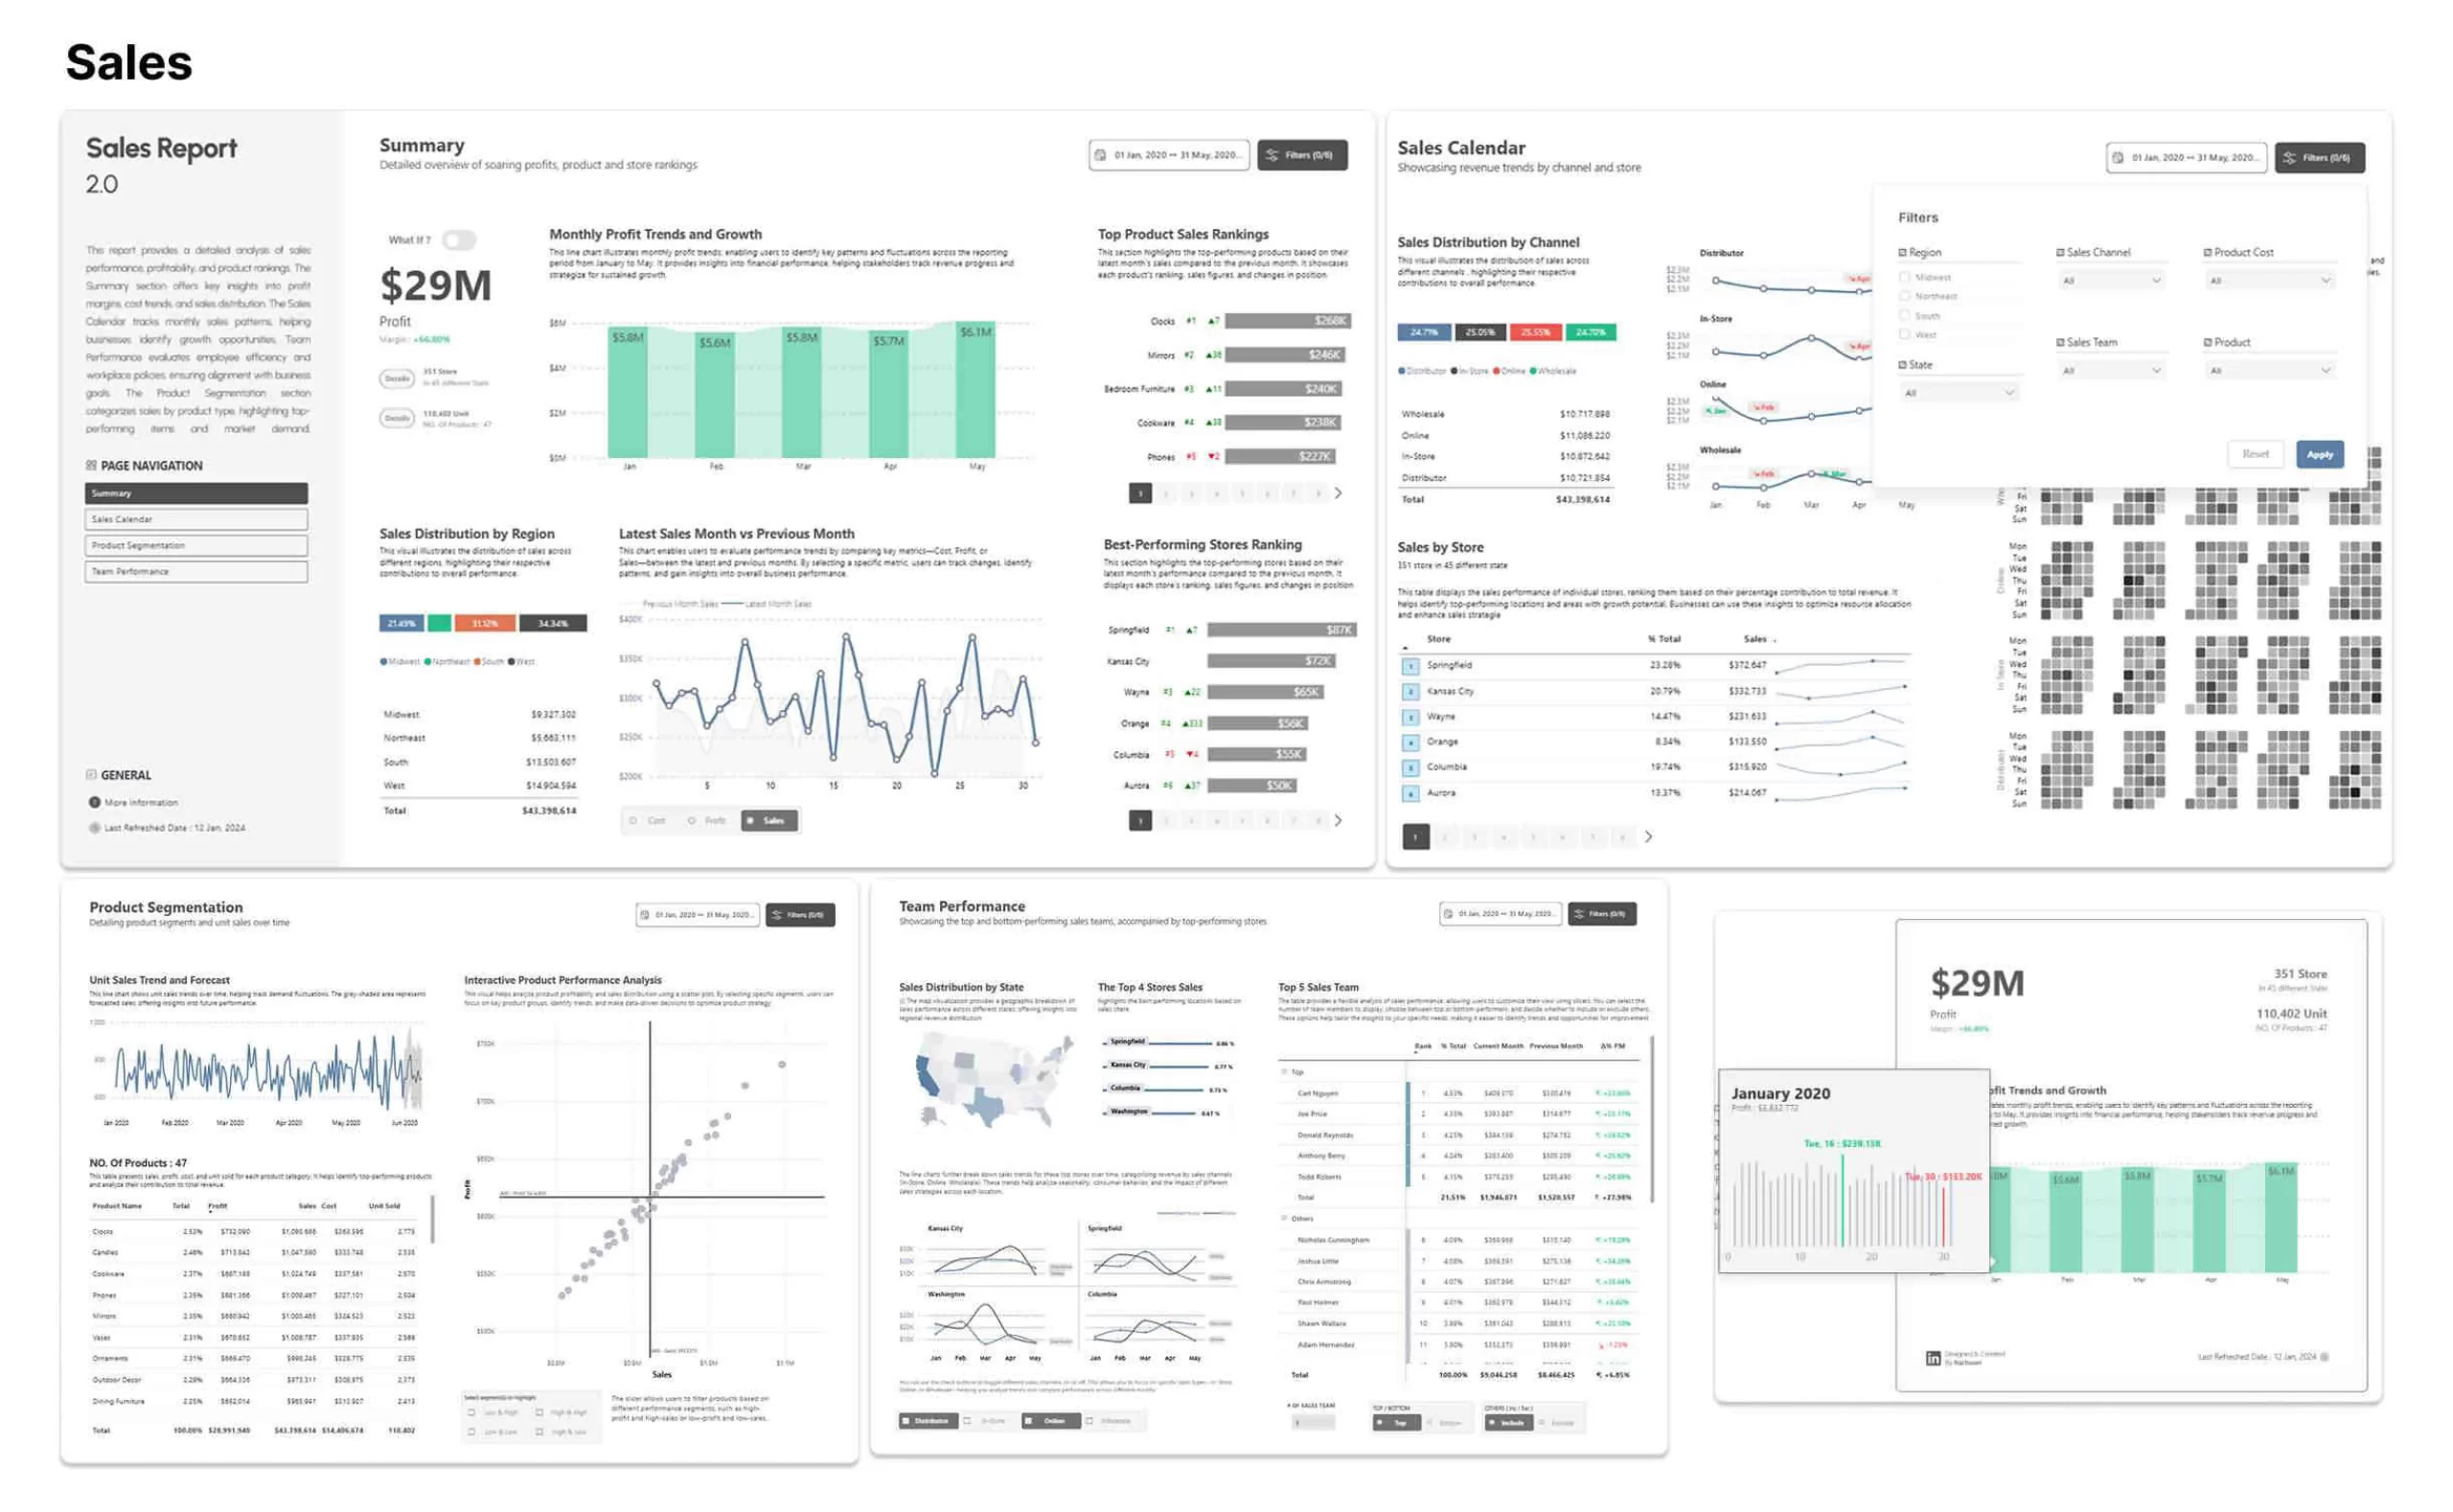
Bespoke Sales Dashboards
Our sales dashboards are custom built around the metrics that matter in your industry, and not a generic layout you have to work around. Your team gets a clear, focused view of performance, with the ability to trace numbers back to where they came from.
- Sales Performance Overview
- Lead & Conversion Analysis
- Customer & Product Insights
- Sales Representative & Team Performance
- Revenue & Forecasting
- Supplier Analysis
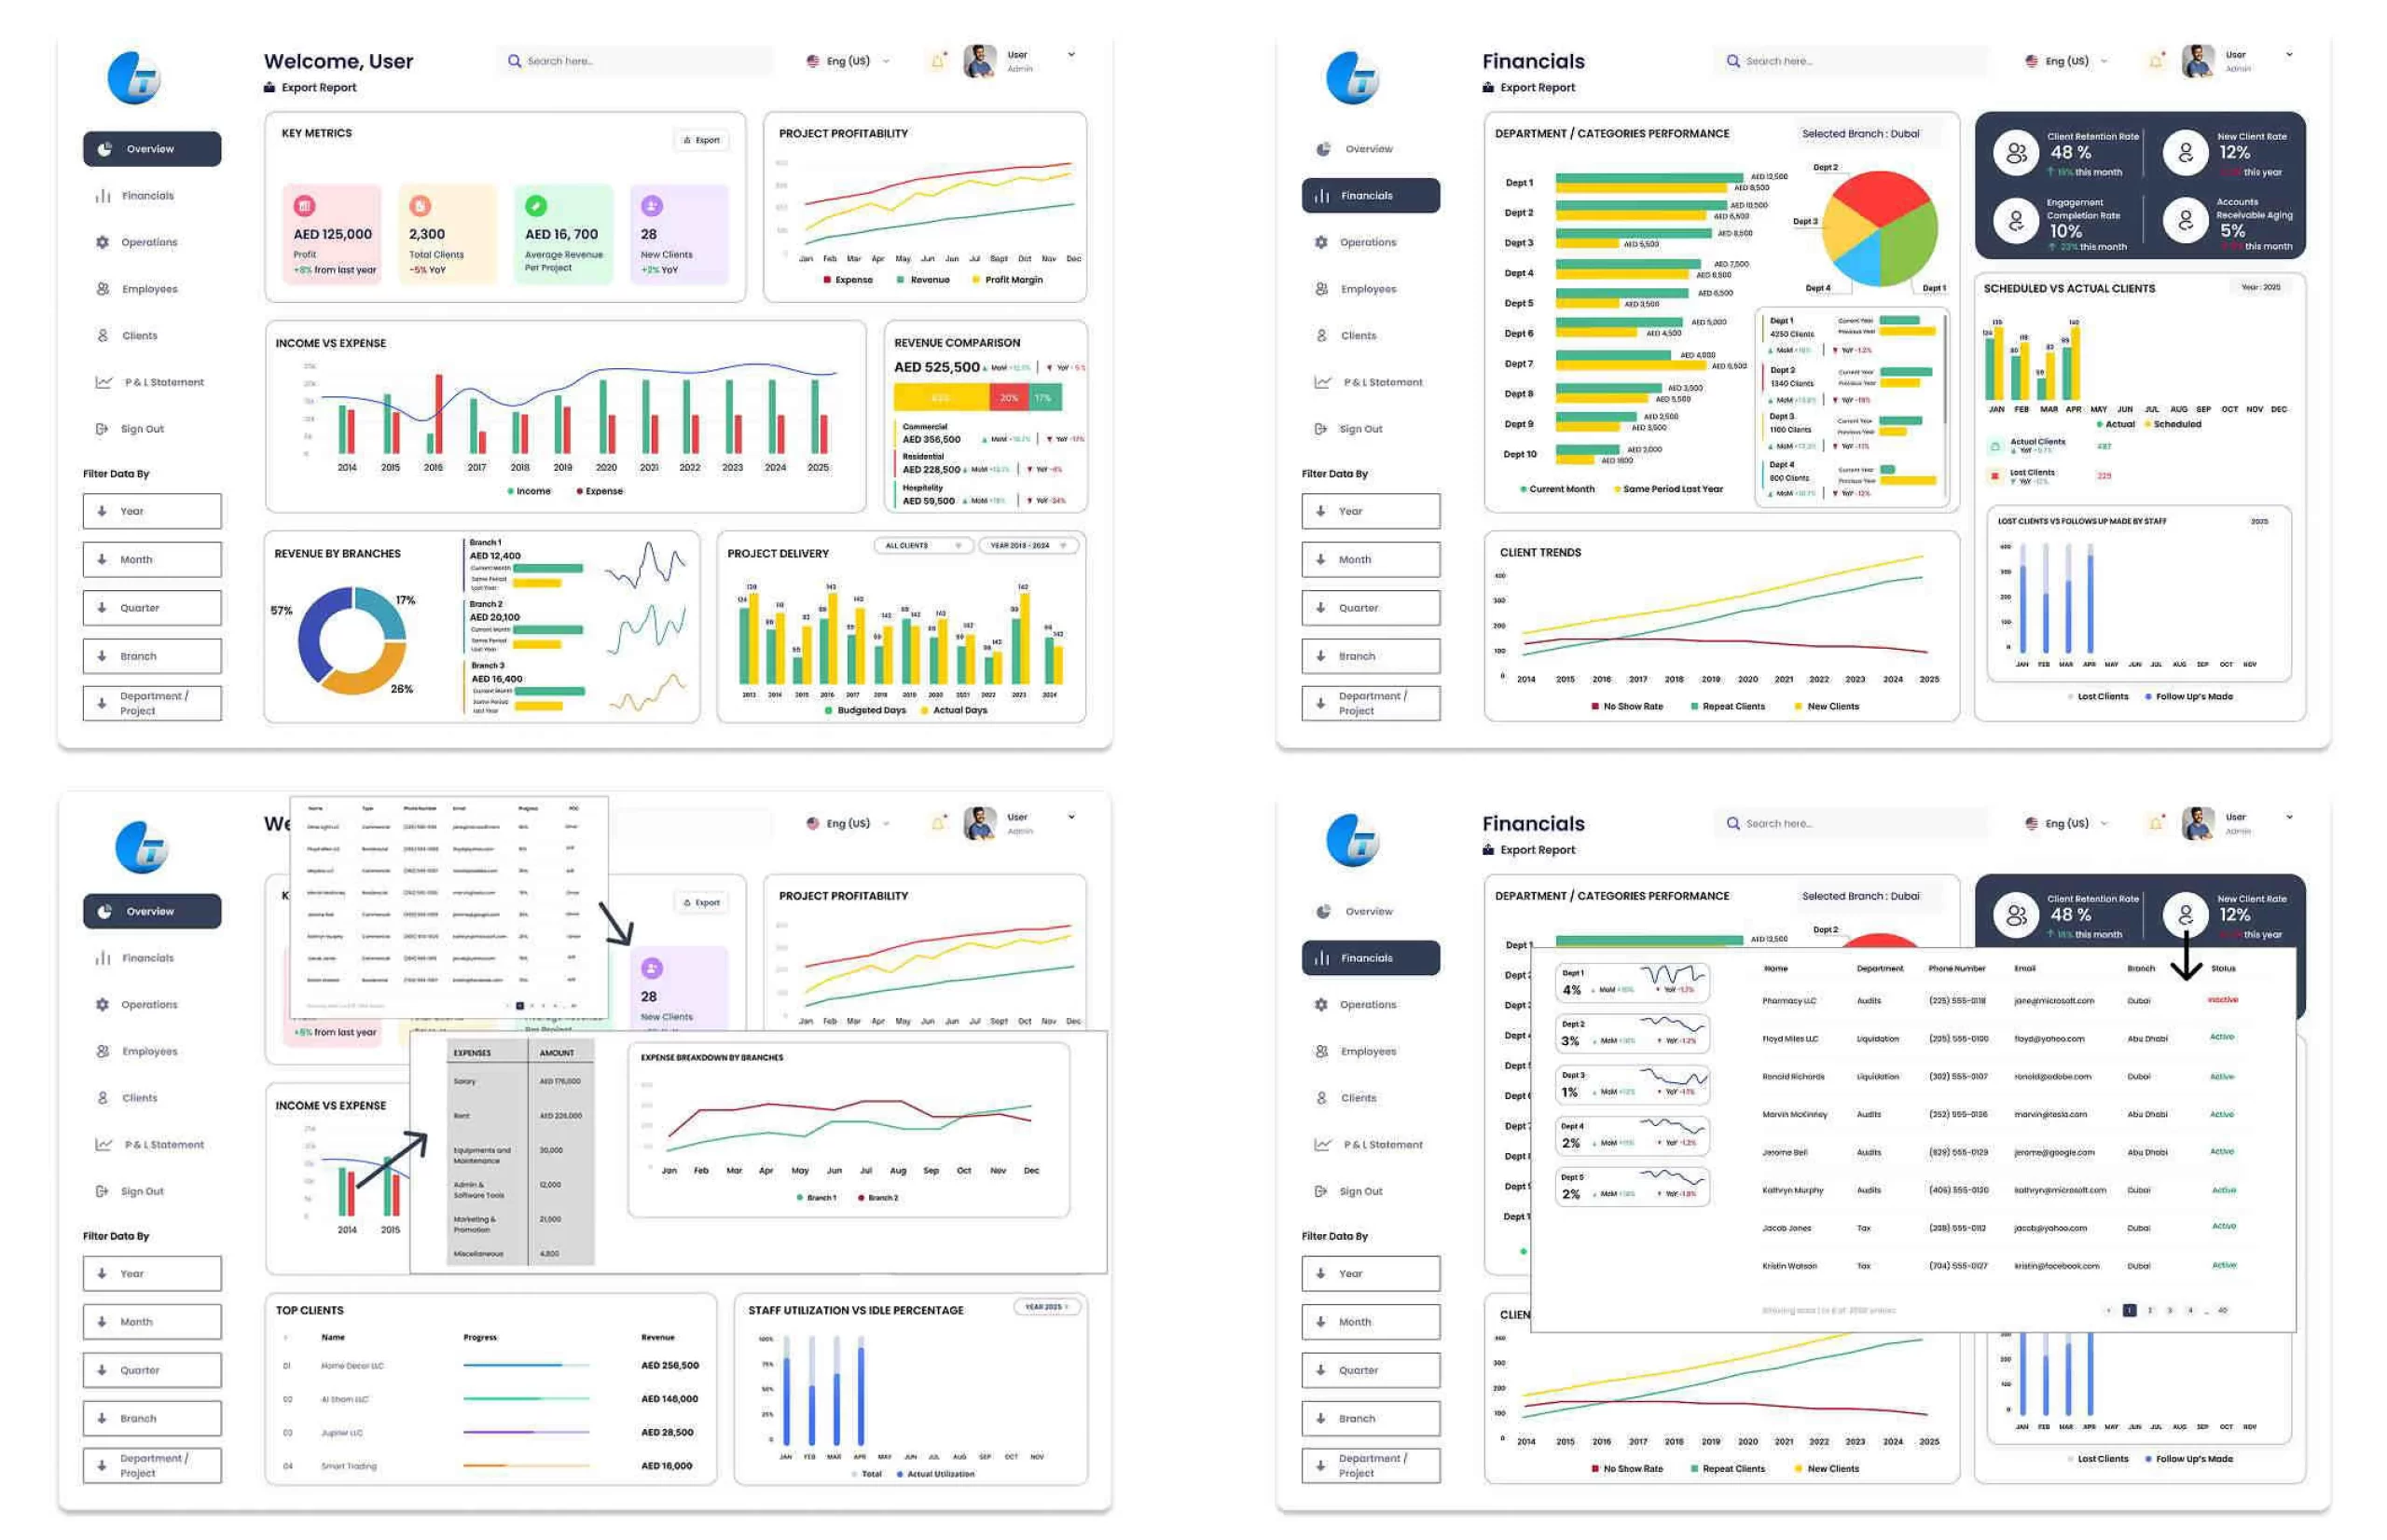
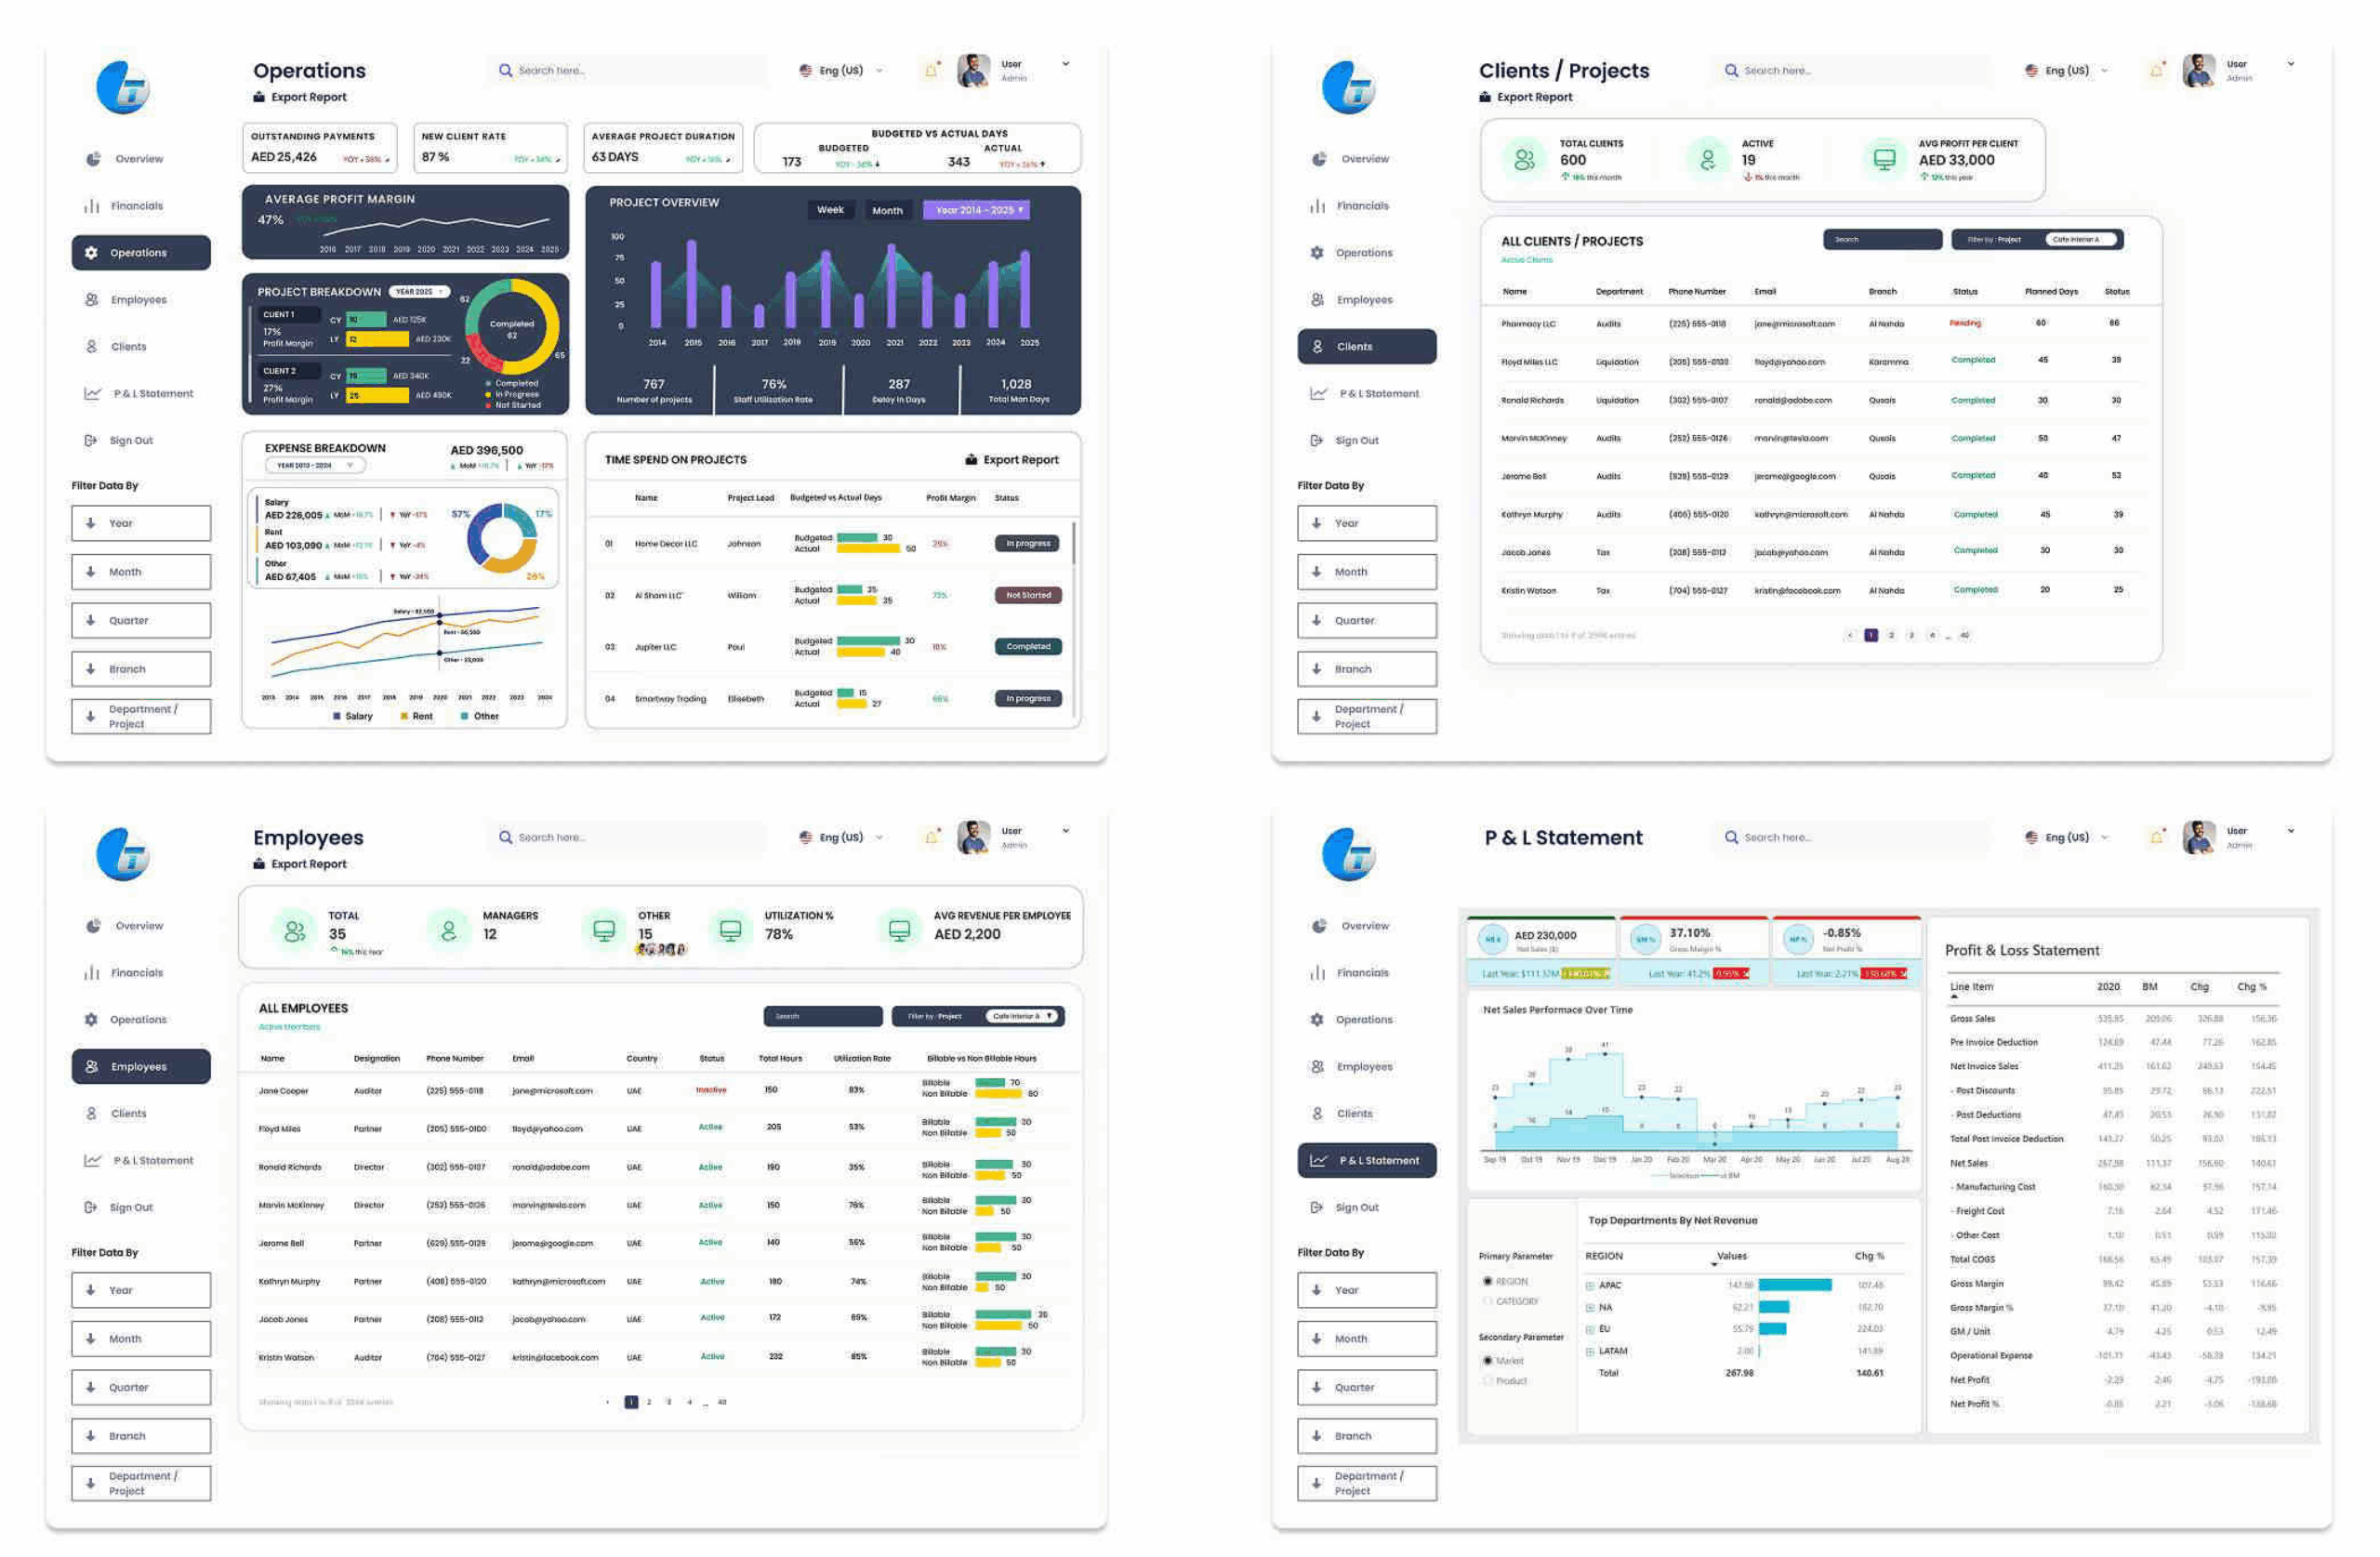
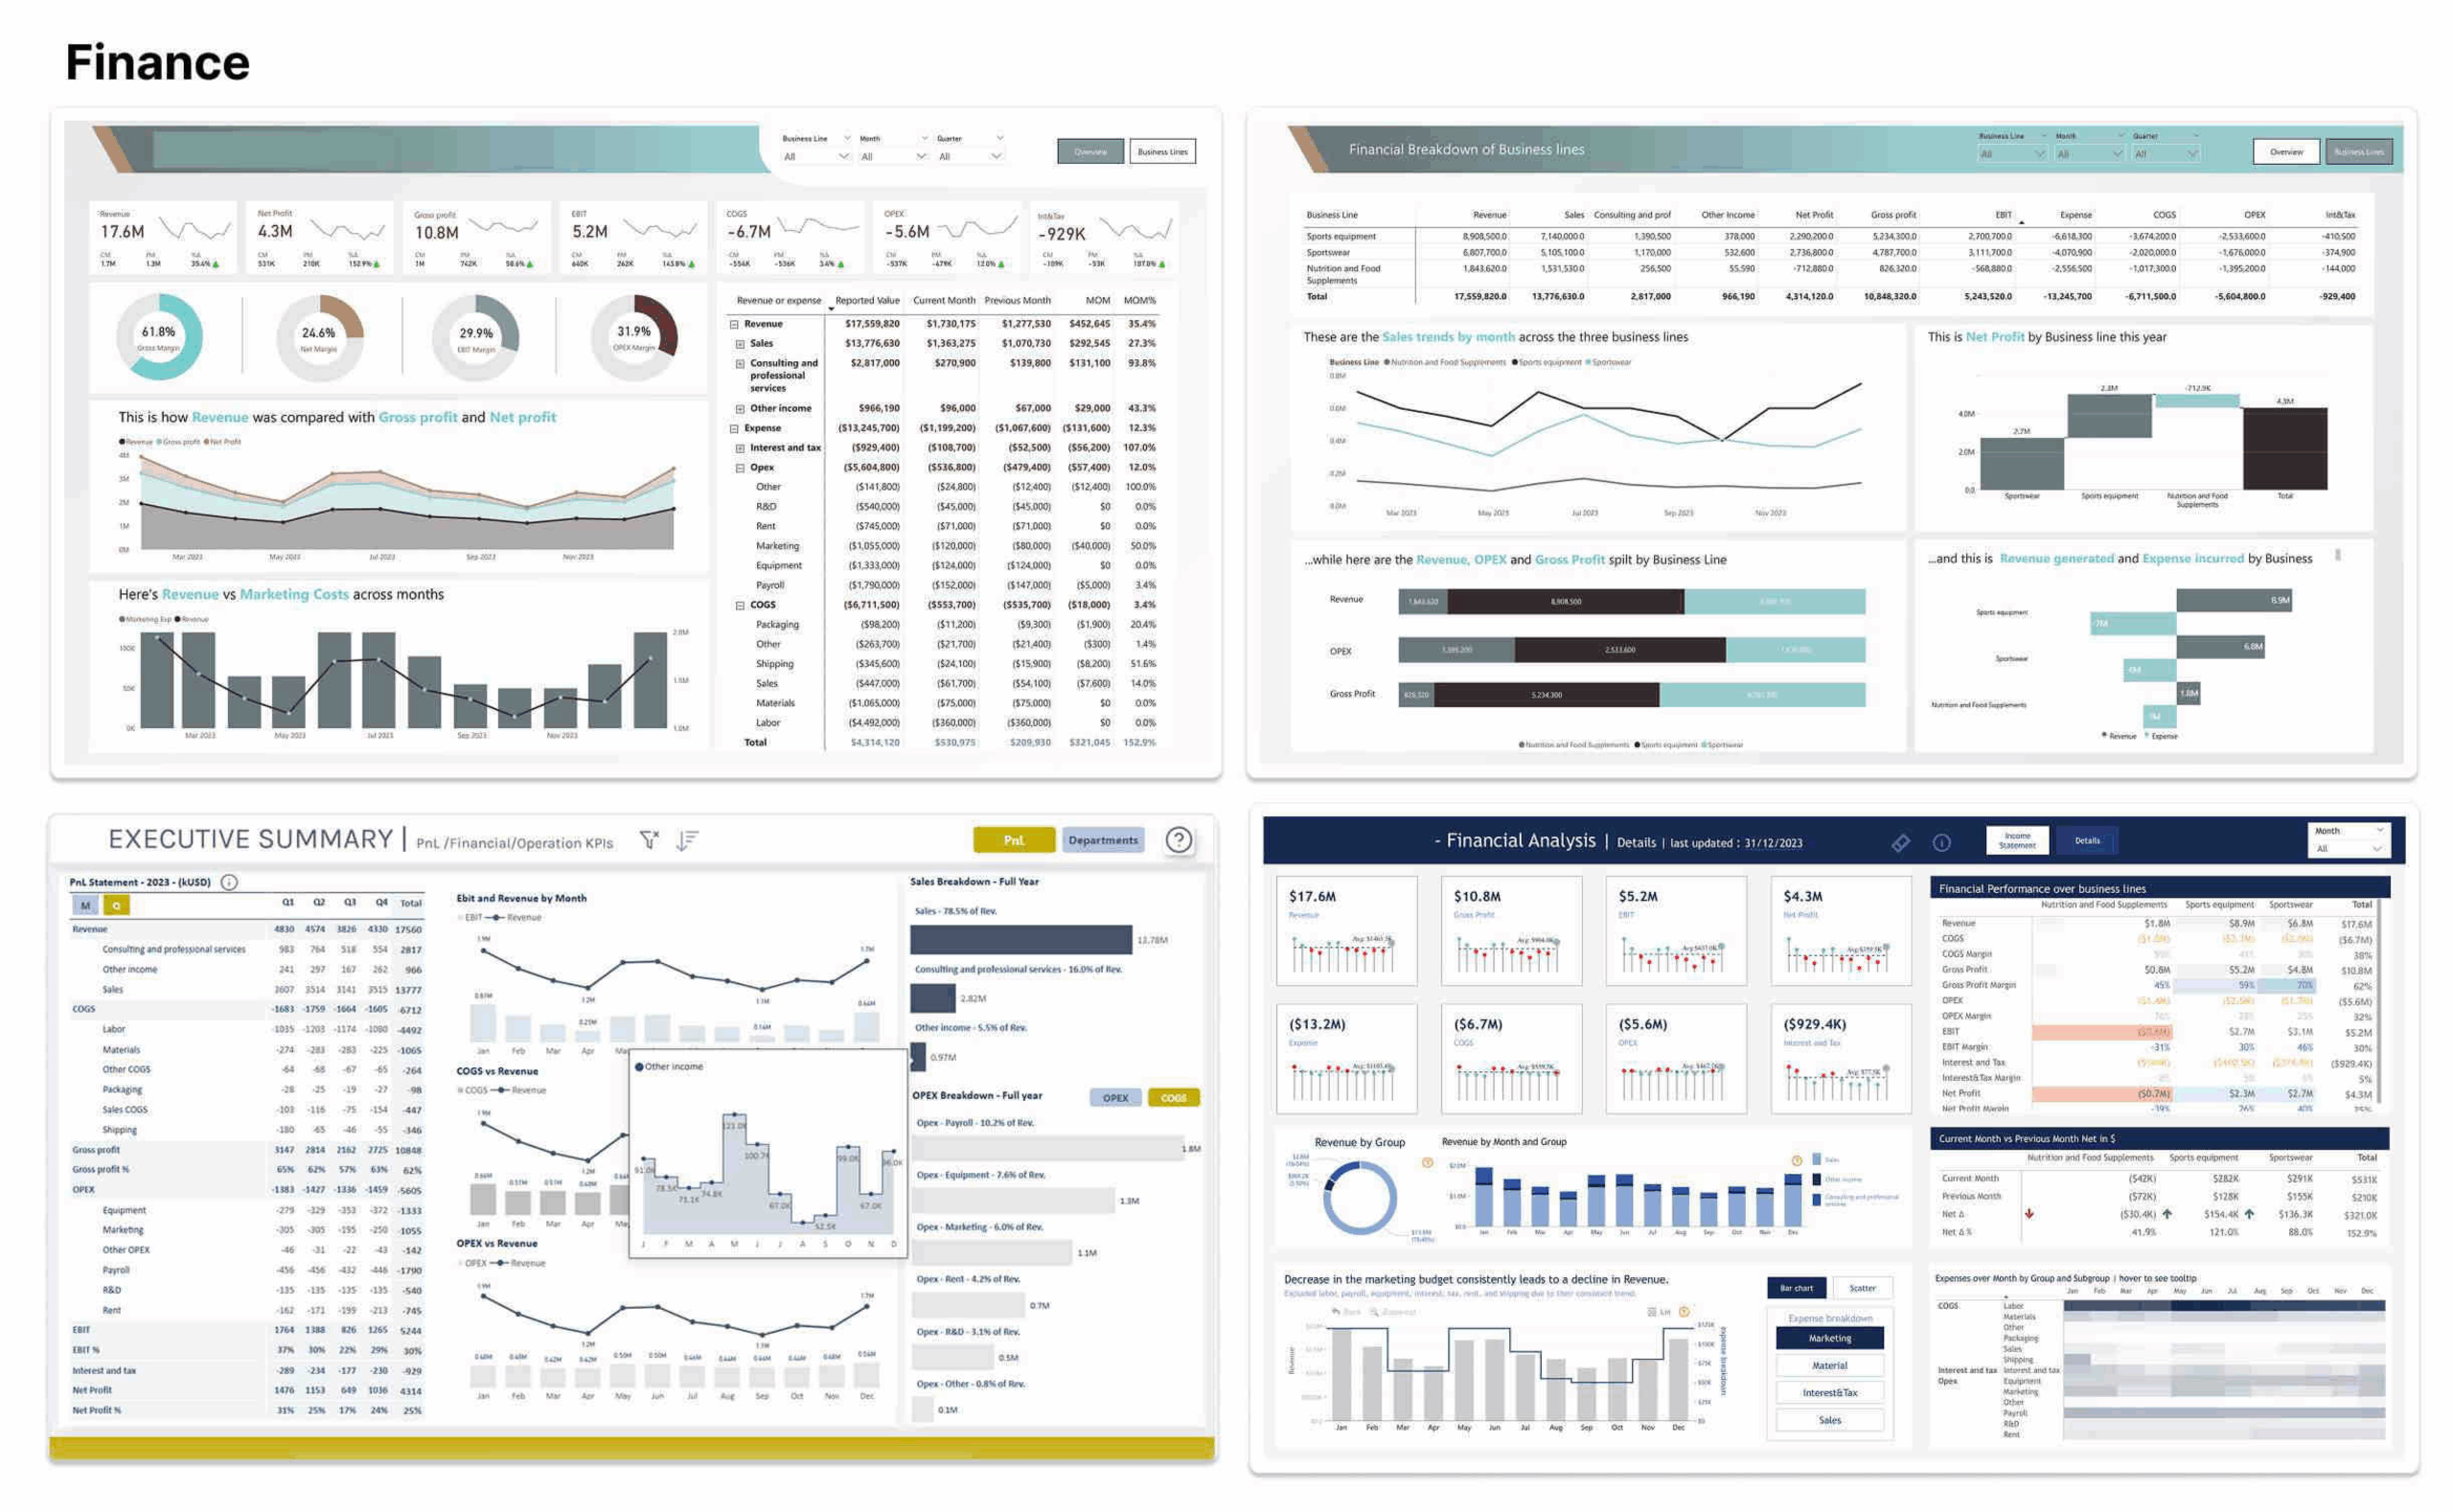
Fully Automated Finance Dashboards
Our dashboards are custom built around your key financial data so the right people have what they need, when they need it. We cover the areas that matter most to financial decision-making, including:
- Financial Summary
- Profit & Loss Statement
- Balance Statement
- Cash Flow
- Budget vs. Actual Analysis
- Accounts Receivable & Payable
- Profitability & Financial Forecasting
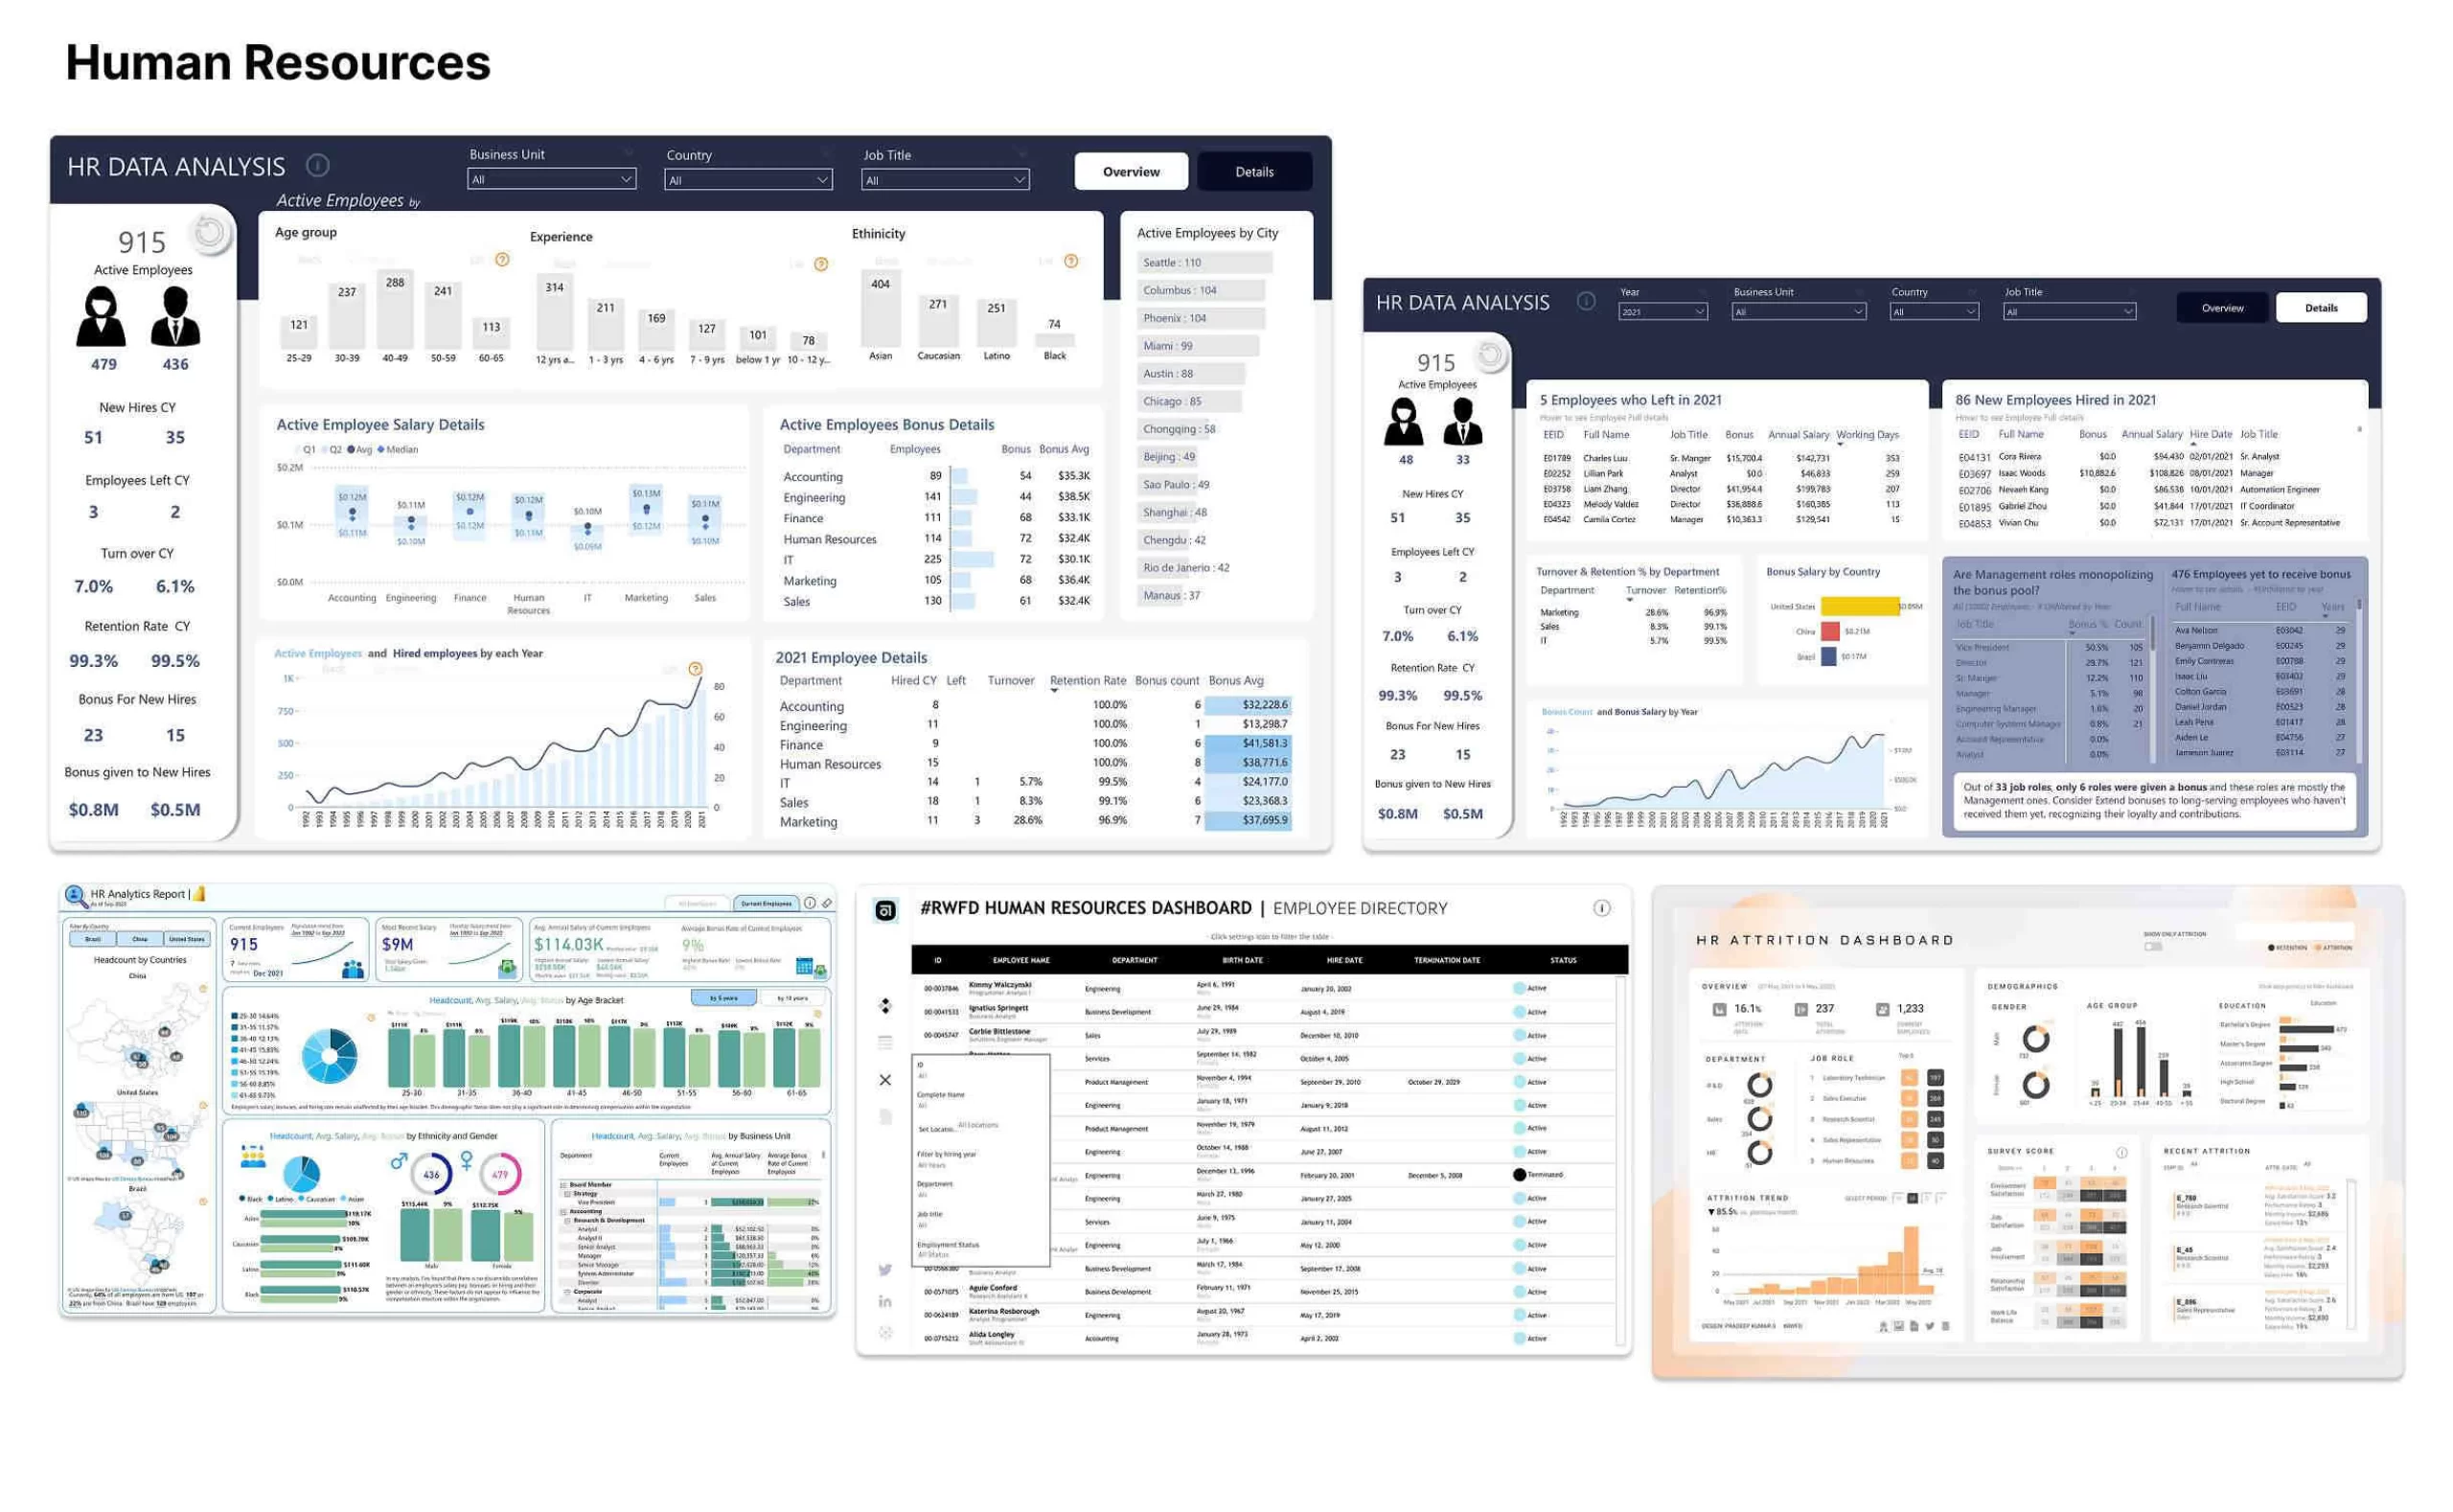
HR Dashboards
Our dashboards bring your workforce data together in one place, headcount, performance, attrition, and more, so your team spends less time compiling reports and more time acting on them. We cover areas including but not limited to:
- Recruitment & Onboarding Analysis
- Attendance & Shift Management
- Employee Retention & Turnover
- Payroll & Compensation Insights
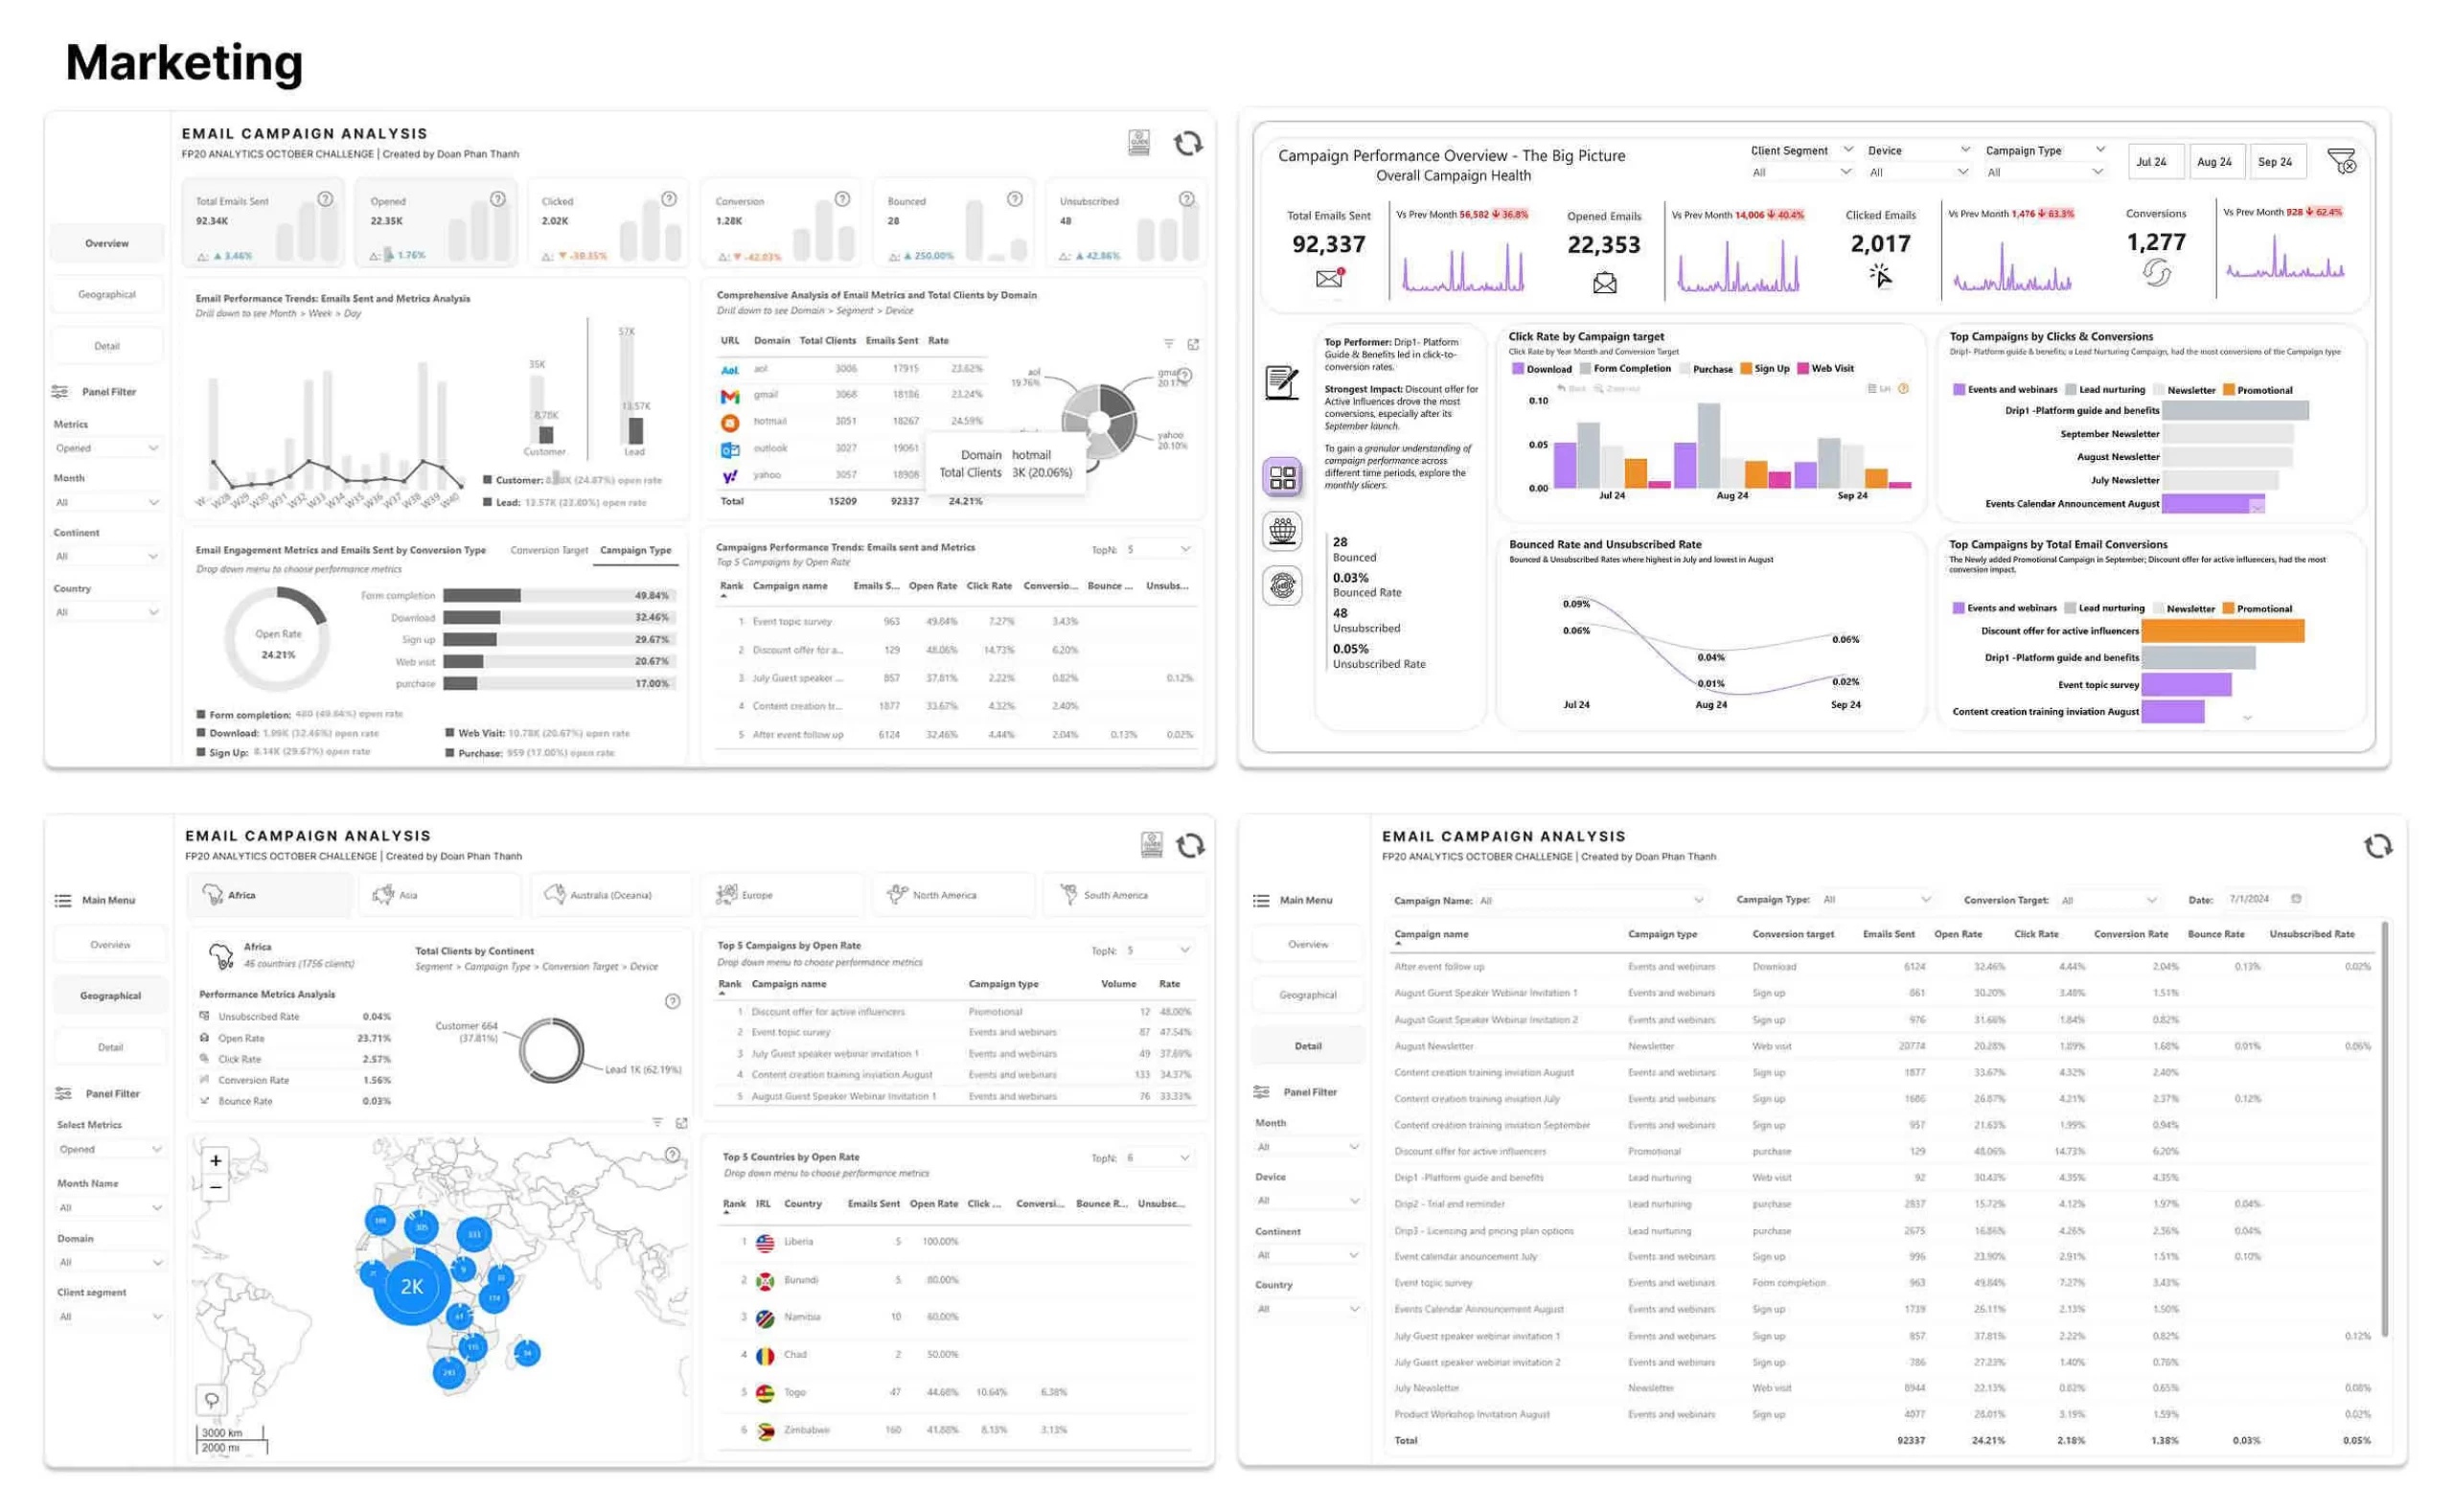
Marketing Dashboards
Marketing generates a lot of data. The problem is usually getting it into one place and making sense of it quickly. Our dashboards do that, by pulling together campaign performance, channel metrics, and customer behaviour so your team can see what’s working and shift focus accordingly. We cover areas including but not limited to:
- Campaign Performance Overview
- Lead Generation & Conversion Rates
- Customer Engagement & Retention
- Marketing ROI & Budget Analysis
- Brand & Social Media Analytics
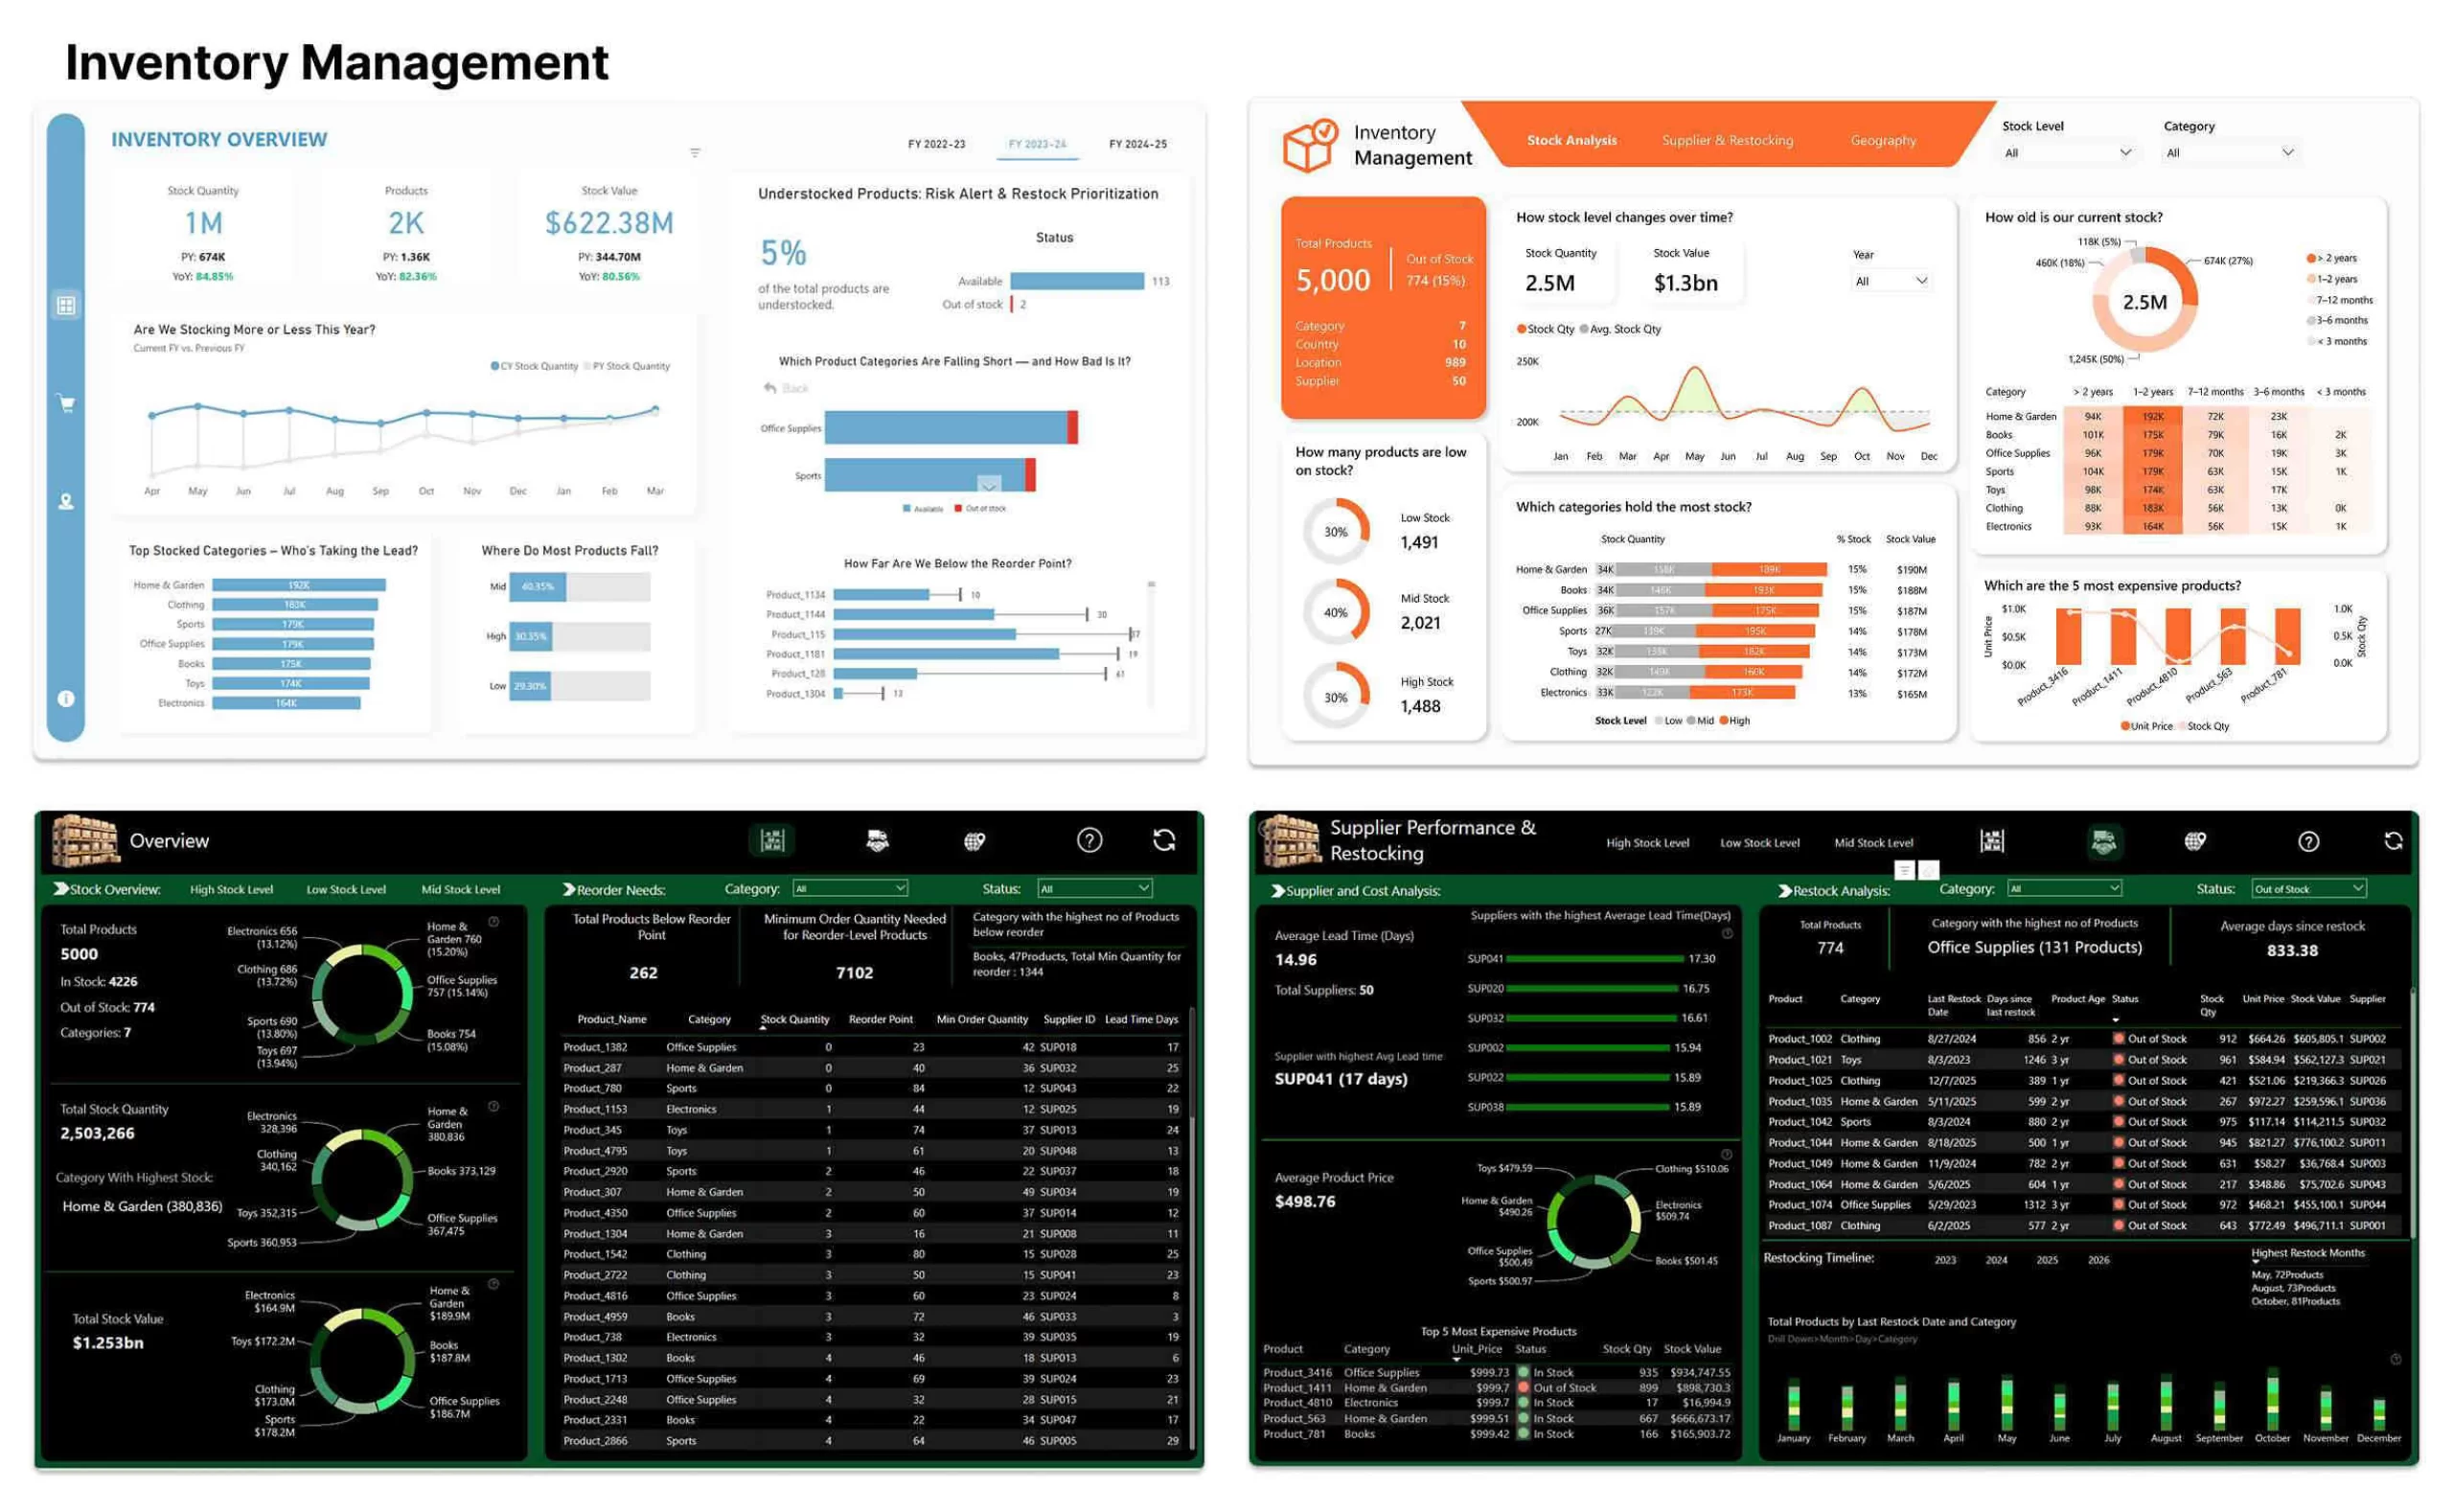
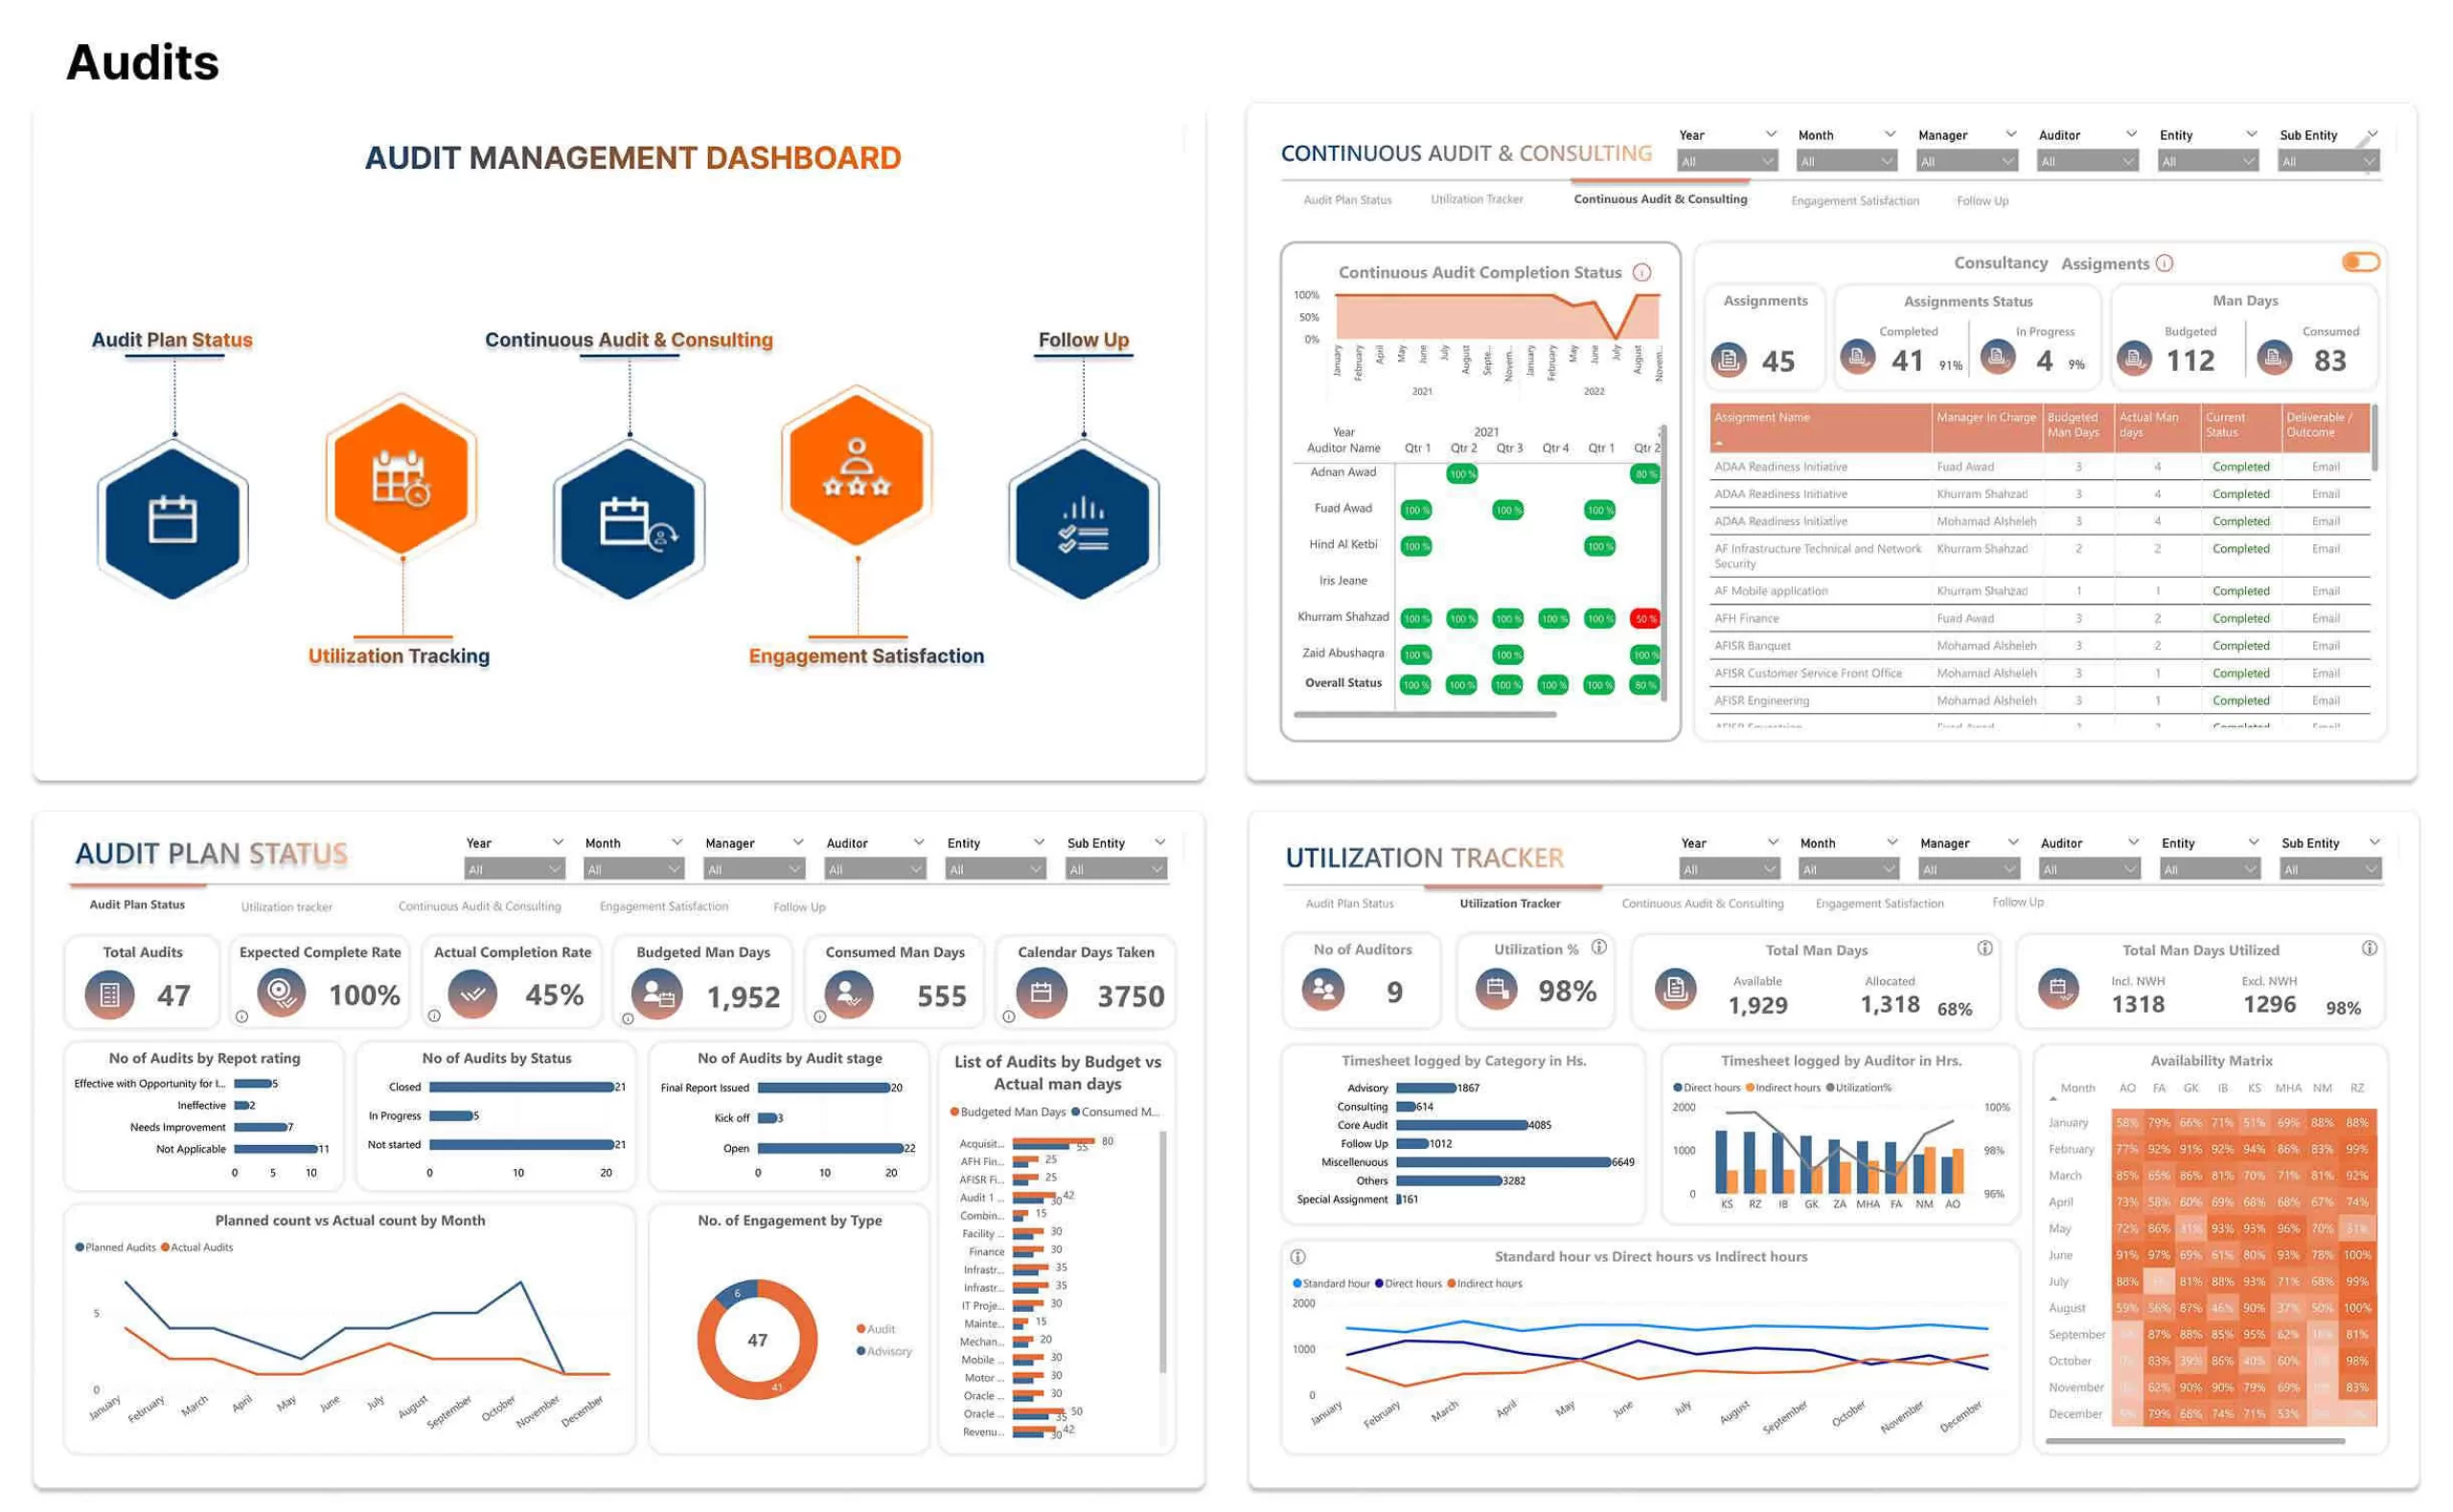
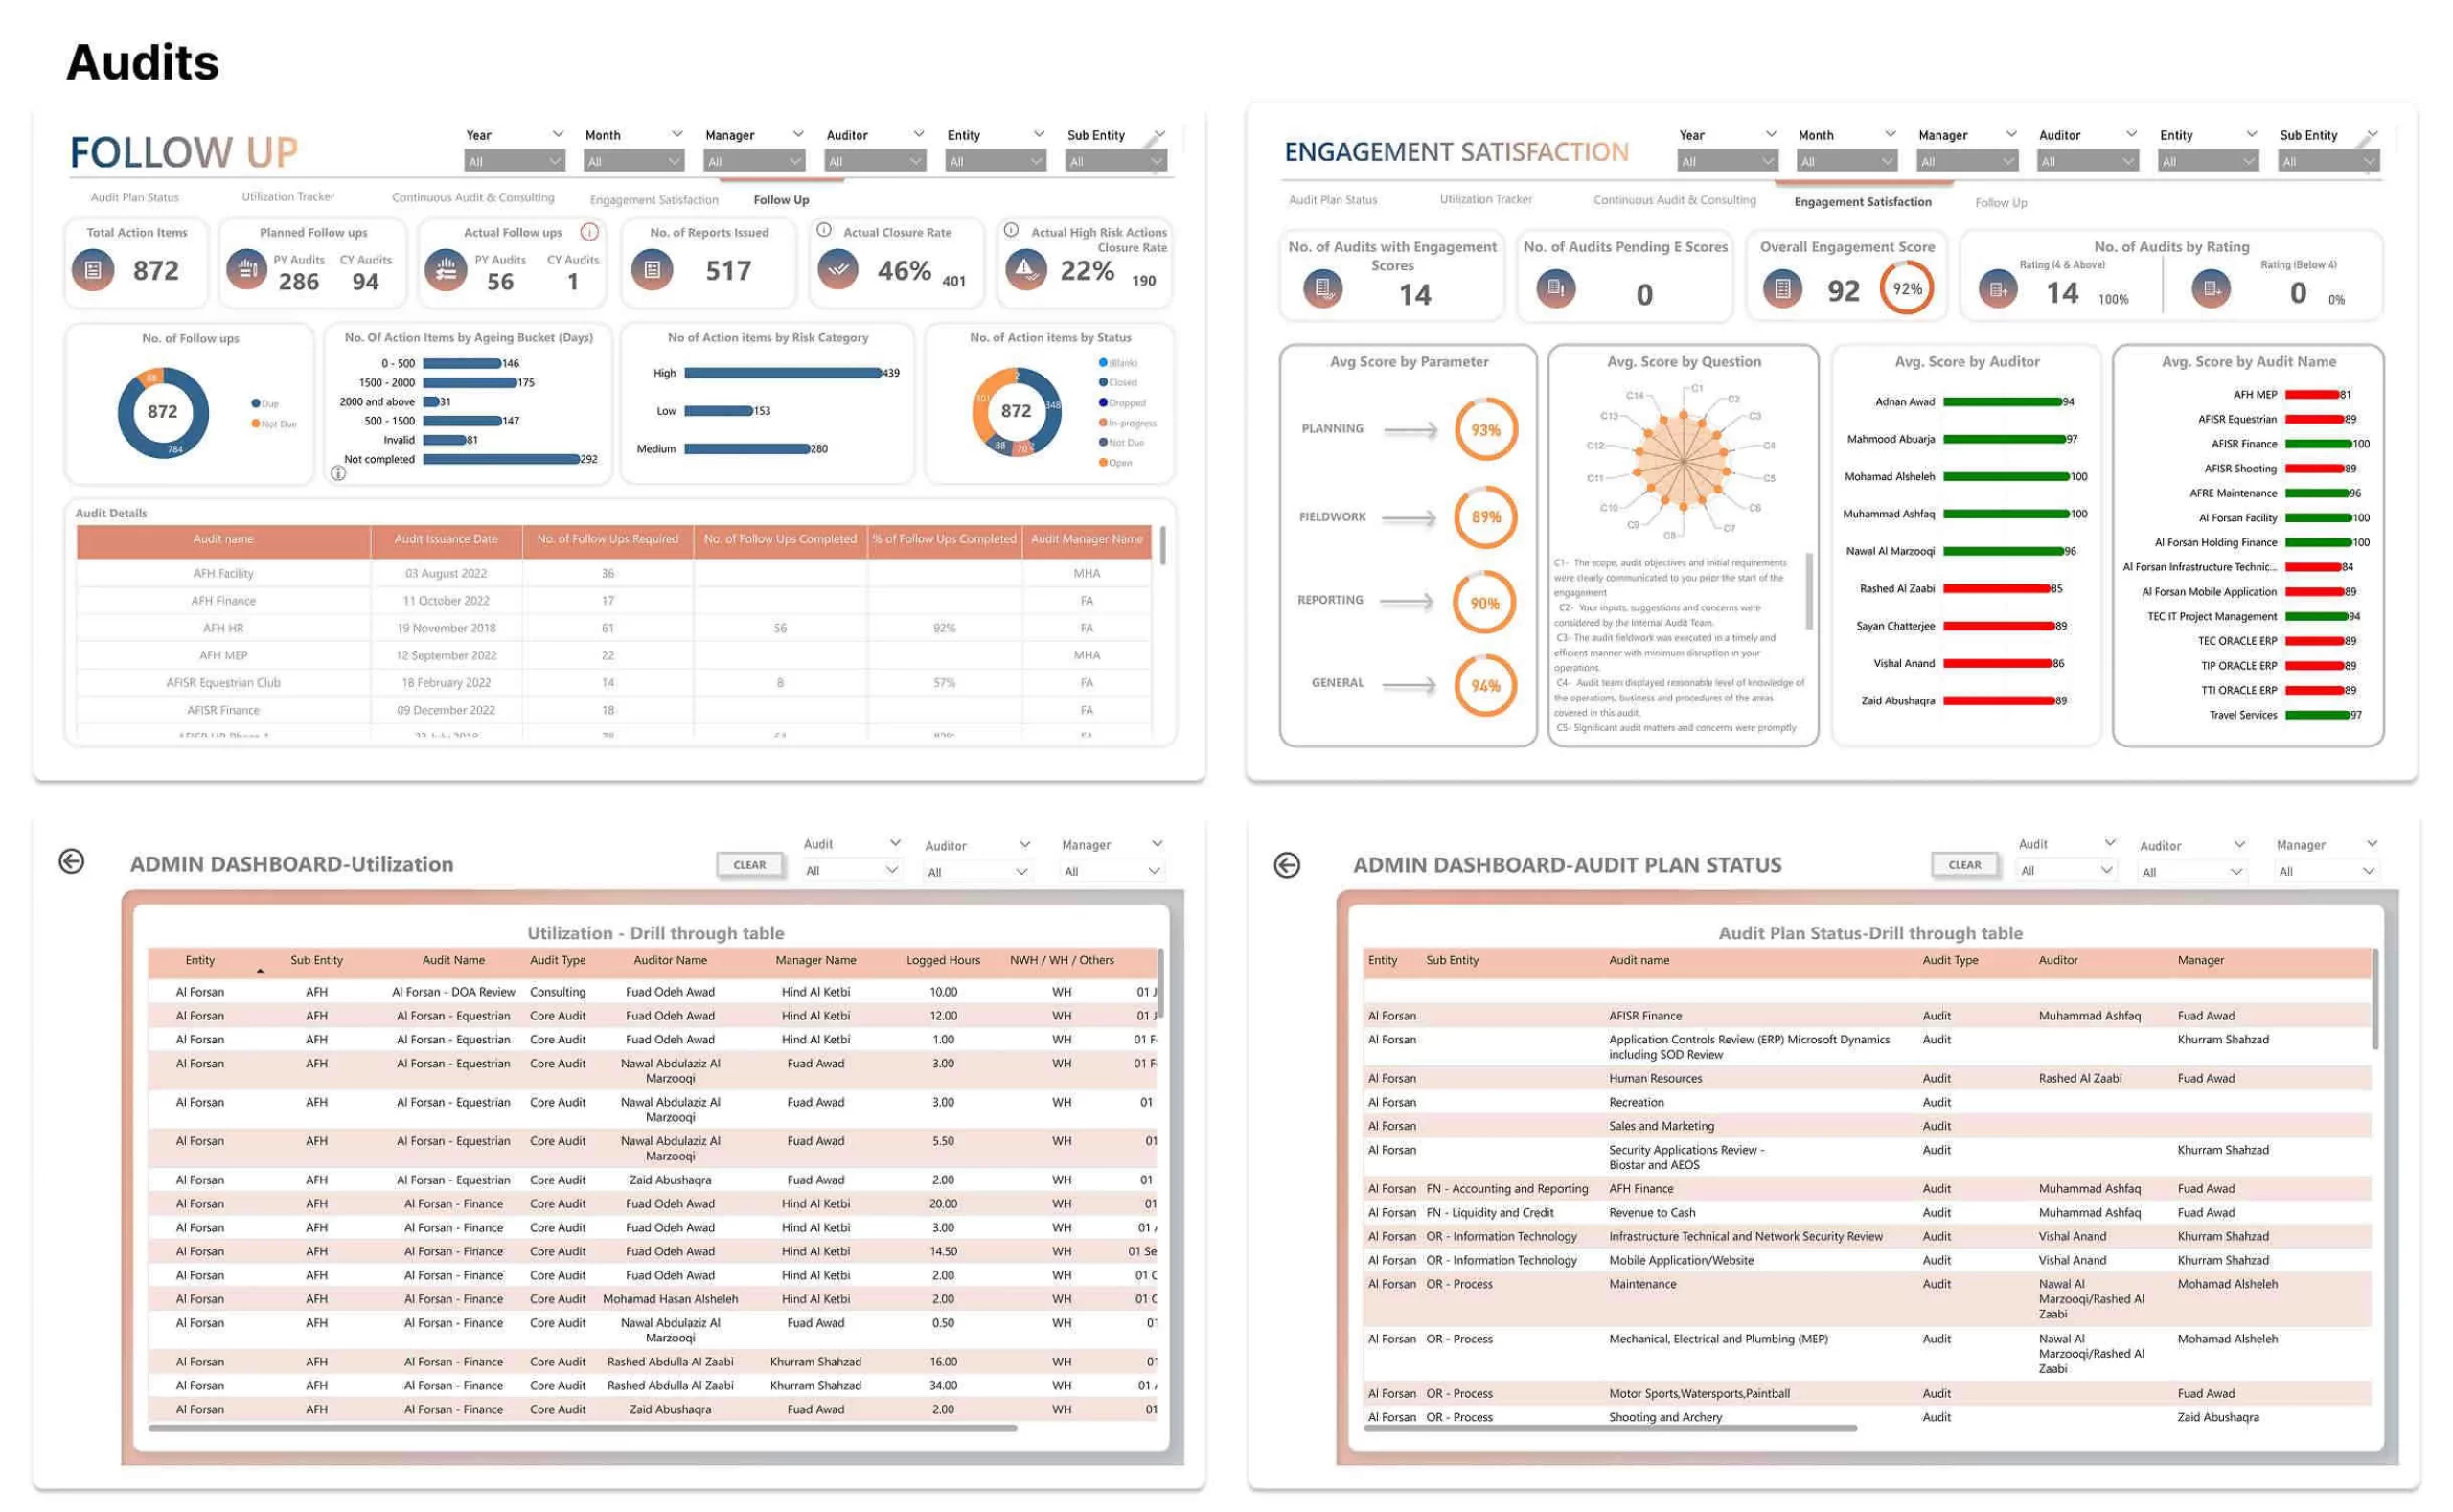
Audit Dashboards
Our auditing dashboards centralise the financial and operational data your team relies on during reviews, reducing manual effort, improving audit trail visibility, and keeping compliance and risk management on track.
- Financial Audit Overview
- Regulatory Compliance Monitoring
- Risk Assessment & Fraud Detection
- Operational & Internal Audit Insights
- Audit Trail & Documentation Management
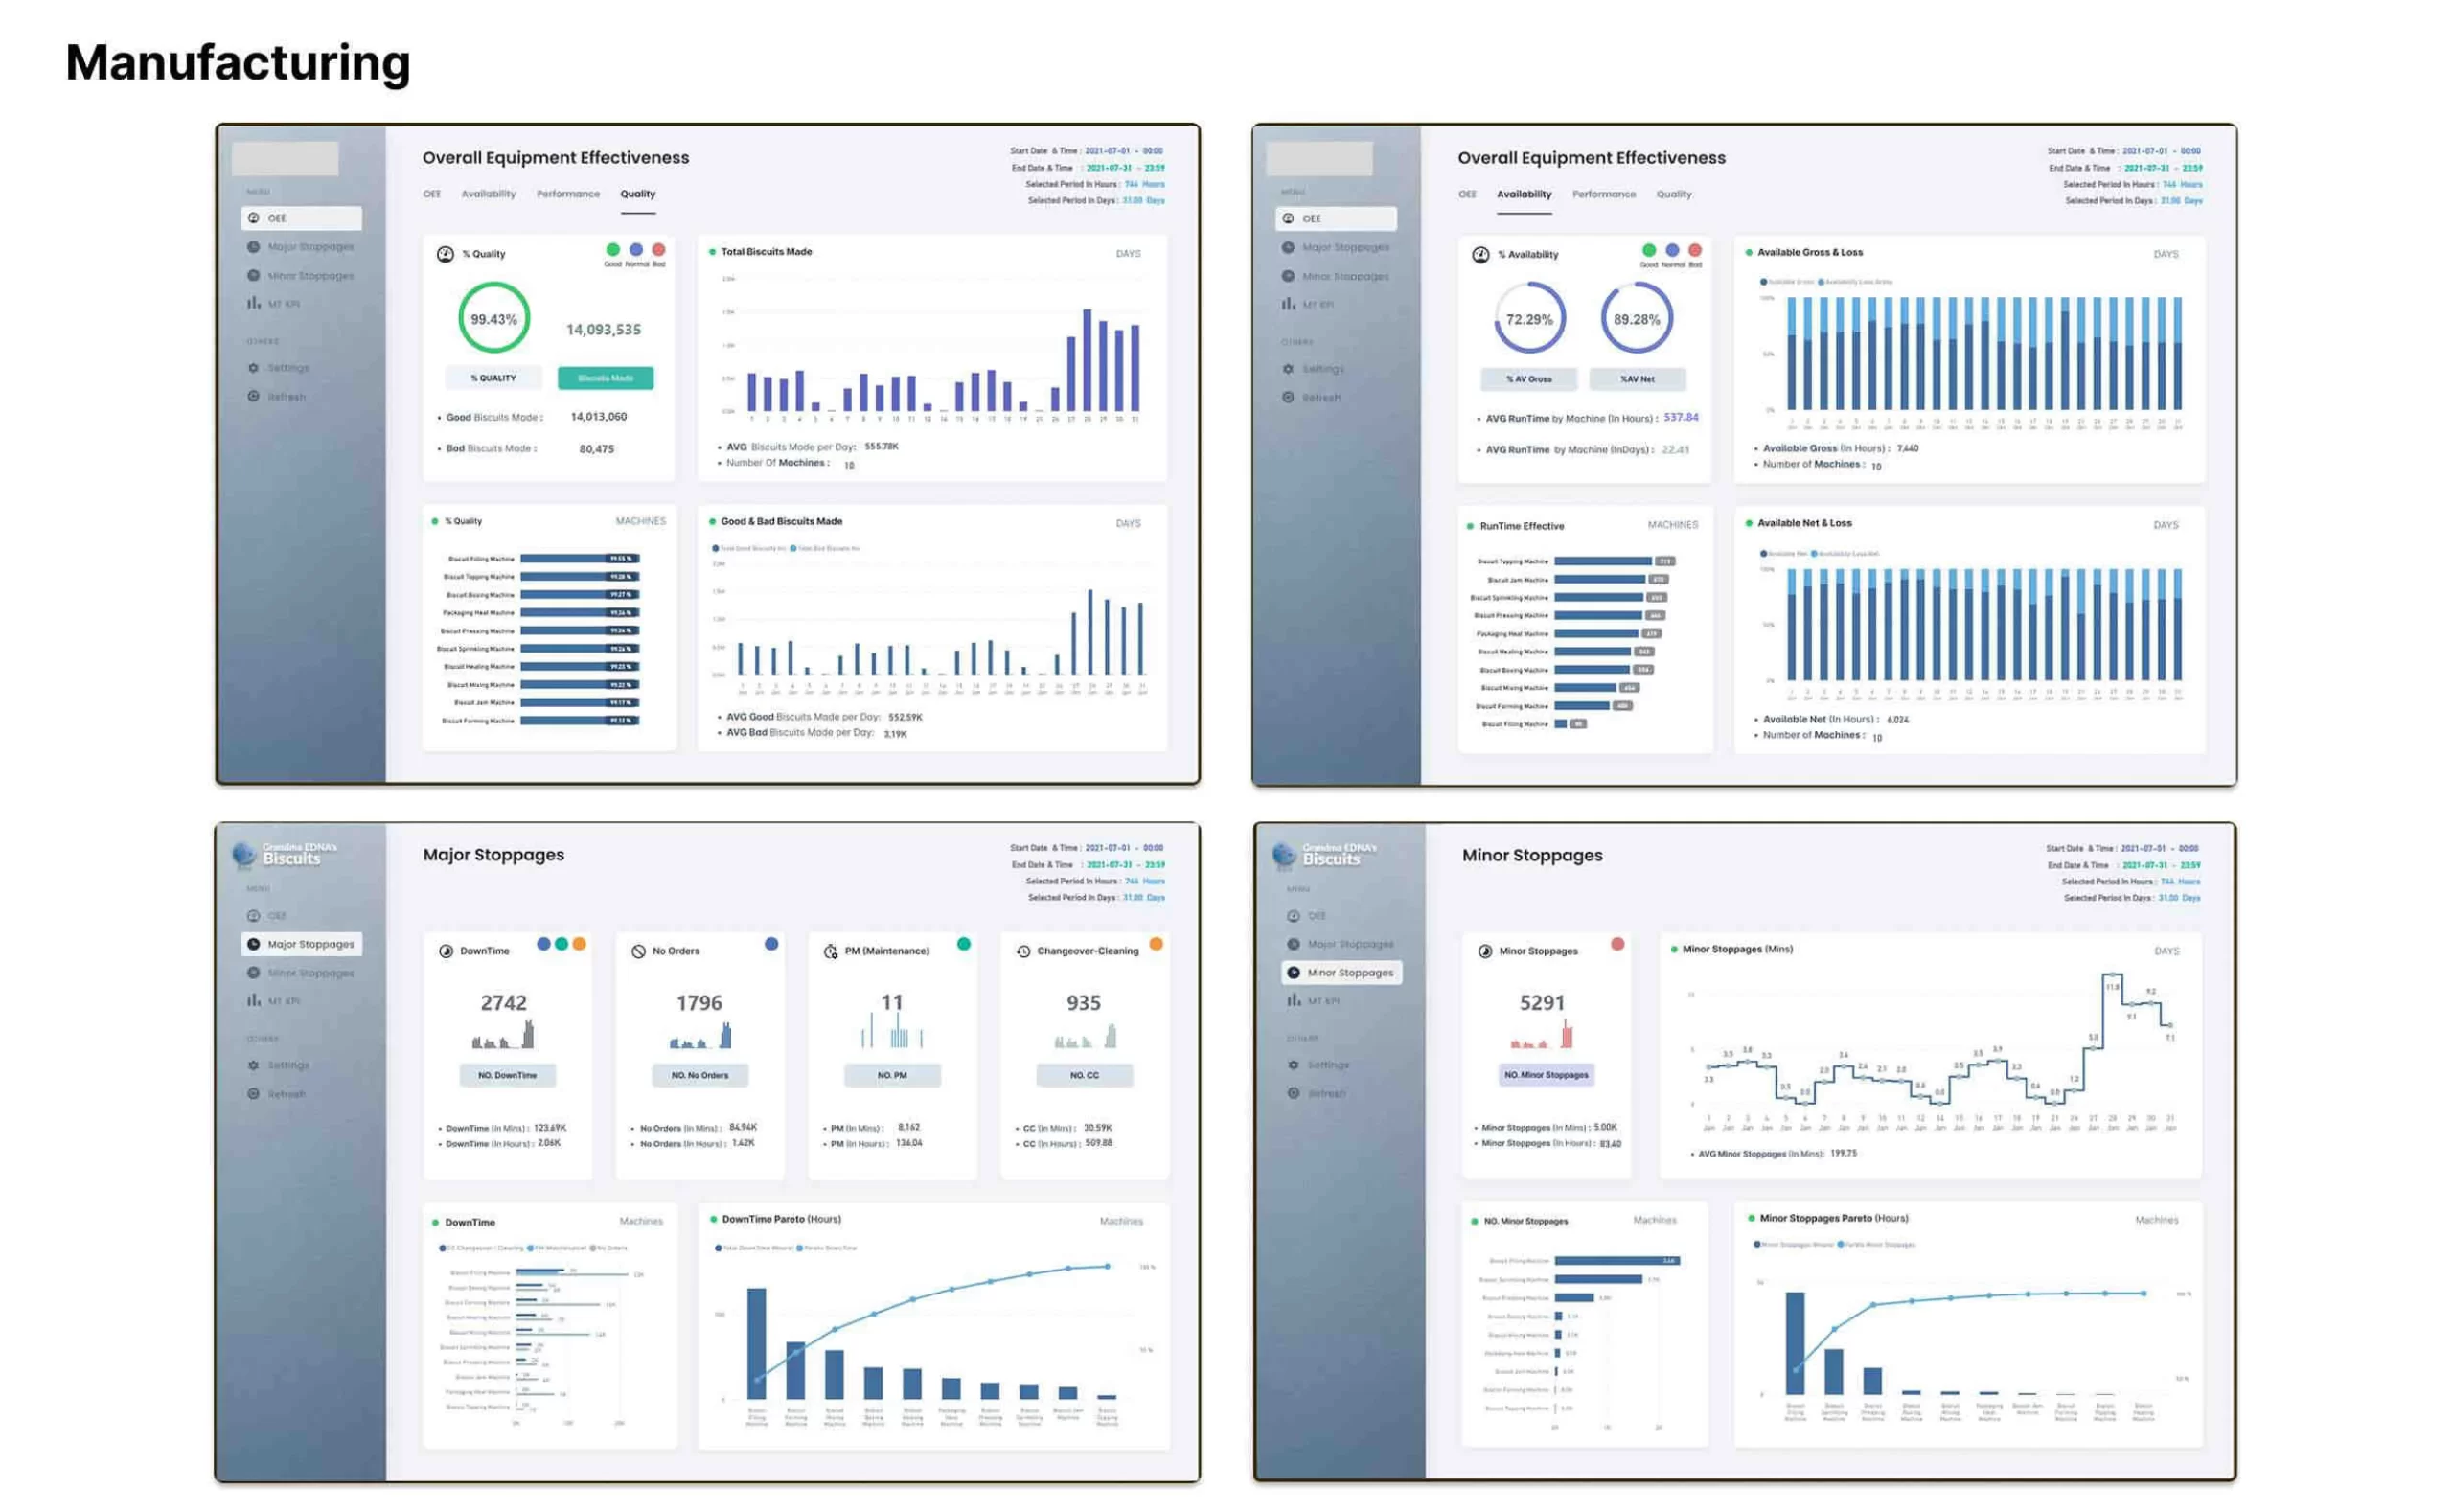
Where data becomes actionable insights
Utilizing industry leading platforms such as Power BI and Tableau
Case Studies
Proven Results Across
Multiple Industries
Educational University
UAE
Power BI Data Visualization and data engineering for a leading University in the UAE
A key university in the UAE approached us with a problem statement, their finance team was rebuilding reports from scratch, all manually. Accountants and finance teams exports data from various platforms, and create reports including cashflow statements, balance sheets and other finance KPI’s in Excel.
How We Made It Happen
We made four dashboards, each one for a different department.
- Finance Dashboard: Balance sheets, cash flow statements, and core financial KPI generation completely automated.
- Sales Dashboard: shows real-time updates into metrics such as admissions numbers, revenue trends, conversion rates etc.
- Marketing Dashboard: Google, Meta, and LinkedIn Ads data brought into a single view, with campaign performance and spend tracked consistently.
- Operations Dashboard: Daily academic and administrative metrics in one place, so management could monitor performance across the institution without chasing individual reports.
Connecting everything is a central data warehouse we built to aggregate data from Zoho Analytics, the ad platforms, and the university’s internal systems. All four dashboards draw from the same source, so figures stay consistent across teams.
Bank
UAE
Transforming Analytics for a Leading Bank with Power BI Dashboards
A UAE bank needed to fix how their HR team handled reporting. The short version: everything ran through Excel. Data came from several internal systems, someone pulled it together manually, and by the time a report is generated, it was already a few steps behind reality.
How We Implemented It
We built a set of Power BI dashboards to cover the main areas HR was struggling to report on efficiently.
- Emiratization: Emiratization compliance was the most time-sensitive requirement. The dashboard tracks national versus expatriate workforce ratios and gives the compliance team an up-to-date view against the mandates, without anyone having to build that view from scratch each time.
- Recruitment: For recruitment, the team now has a live picture of where candidates are in the pipeline, how long hiring is taking per department, and where bottlenecks tend to form.
- Performance: Performance reporting was another gap. Appraisal data from across departments now feeds into a single dashboard, making it easier to identify strong performers and spot where additional development is needed, rather than waiting for a quarterly review cycle to surface that information.
- Attendance, leave, and absenteeism are tracked automatically. Same for training participation, completion rates, and whether performance shifted afterward. Retention and attrition data is broken out by department and tenure, so leadership can see where turnover is actually concentrated rather than looking at a company-wide average.
The whole thing runs off a central data warehouse we built by connecting the bank’s HRMS, SAP systems, payroll platforms, and compliance tools. Access is role-based throughout, each user sees what’s relevant to their function, nothing more.
Meet Our Process
From requirement gathering and strategy to design, implementation, deployment, and ongoing support, we ensure a seamless journey from concept to successful AI adoption.
01
Discovery & Strategy
First, we understand what you’re trying to achieve and what’s slowing you down. Then we build a plan tailored to this.
02
Solution Design & Implementation
Once the plan is finalized, we move into development, split across sprints. This is where our team changes the plan into reality.
03
Development & Continuous Optimization
Once development is done, UAT and VAPT sign-offs are cleared, we push to production. After go-live, we move into ongoing support.
Why Choose Us
Interactive
Dashboard Solutions
Most businesses aren’t short on data. What’s harder is having it in front of the right people, in a format they can actually use, without someone manually pulling it together each time.
We build BI dashboards and data analytics solutions that keep your teams current on sales, revenue, customer activity, and operational KPIs updated in real time, accessible on any device, and built around how your business actually runs.
Key Takeaways
Seamless BI Implementation & Data Integration
We connect your ERP, CRM, and other data sources into a single reporting pipeline that updates automatically. Raw data is cleaned, structured, and standardised before it reaches your dashboards, so your teams are always working from figures they can rely on, not previous exports.
Co-sourcing
Looking for specialized skills or extra resources during peak periods? Fill your IT gap, add flexibility to your current team, and create a pool of Certified Data Analysts, Power BI/Tableau Developers, AI/ML Engineers, & more, along with dedicated project managers for managing and handling concerns.
Privacy and control
All data is stored in UAE-based data centres and remains entirely in your hands. Nothing is retained on our end, and access is limited to authorised users only. That means your data stays within UAE jurisdiction, meets local compliance requirements, and isn’t accessible to anyone outside your organisation.
Support & Service
At Aleddo, delivery is not the end of the engagement. Your BI solution is maintained and improved over time, and a dedicated project coordinator stays on hand during the project and after to handle any issues or changes that come up along the way.

Power BI
Turn your data into clear, reliable reports with Power BI, built on solid data modelling and analytics that give your teams the information they need to make decisions.
Tableau
Tableau gives your teams a clearer picture of what your data is actually saying through visual analytics and reporting built to support faster, better-informed business decisions.
Alteryx
Alteryx cuts down the time your teams spend preparing and processing data, automating the repetitive work of cleaning, blending, and analysing so the focus stays on understanding the numbers and acting on them.
Built With Privacy In Mind
Making sure your data is protected at all times with trusted, industry-standard security practices, and securely stored within UAE-based data centers, fully adhering to local regulations and compliance standards.
Testimonial
What Our Clients Are Saying
They set up Power BI dashboards that linked to Zoho Analytics to automate financial reporting, such as cash flow statements and P&L. This saves us hours of labor that we would have had to do by hand. They also connected Meta and Google platforms to make a marketing dashboard that lets us see our efforts in real time. Their team was professional, quick to respond, and gave us exactly what we needed.
Thanks to Aleddo technologies, we have built a flexible and powerful BI platform, covering all the company needs. All the marketing and Business data are available daily with no team effort, thanks to automated imports from different data sources. We have a +40% improvement in marketing efficiency.
We got in touch to develop a set of dashboards in sales, as per our management decision where we can track sales, performance, targets, etc along with analytics of customers, purchase trends etc. The process was smooth and they handled everything, guided us through the license procurement, and even suggested KPI's to include.

contact Us
Social network
Our Impact in Numbers
We focus on AI solutions that produce outcomes you can measure, not just better processes, but better business results. Every engagement is built around that.
Client Retention Rate
We make sure every engagement is built on long-term partnership through consistent results.
Adoption Rate
We help businesses by utilizing AI and automation in their real workflows across industries.
Average ROI
Making sure in every engagements, our clients maximizes value and profitability through AI adoption.
How Would You Like To Engage With Us?
We offer multiple models, allowing you to choose the best engagement, tailored to your business needs and requirements.
Co-sourcing
- 176 hours of dedicated developer deployment
- 7 days free trial
- Monthly billing
- Pay as you go
Full Development Contract
- Complete control of development
- Pay as per project
- Single point of contact
- Dedicated Scrum allotment
- Total ownership
Need-Based Contract
- Need-based working
- Zero hidden cost
- Pay for actual measurable development hours
- Monthly billing
Start A Conversation With Our Experts Now
What’s next?
01
Discovery & Strategy
First, we understand what you’re trying to achieve and what’s slowing you down. Then we build a plan tailored to this.
02
Design & Development
Once the plan is finalized, we move into development, split across sprints. This is where our team changes the plan into reality.
03
Deployment & Support
Once development is done, UAT and VAPT sign-offs are cleared, we push to production. After go-live, we move into ongoing support.
FAQ
frequently asked questions
It depends on how many data sources are involved and how complex the reporting needs to be. A straightforward single-source dashboard can be ready in a few weeks. Projects involving multiple systems and a data warehouse typically take longer, and we'll give you a realistic timeline before anything starts.
We are fully flexible and support all major data residency op)ons based on requirements and regulatory needs, including UAE Cloud, GovCloud, on-premise, and hybrid deployments.
It's actually one of the more common situations we deal with. Data cleaning and preparation is part of the process — we structure and standardise the data before it reaches your dashboards, so what you see is reliable.
No. We work with what you already have, whether that's Zoho, SAP, Salesforce, or a combination of platforms. The dashboards connect to your current systems rather than replacing them.
Yes. If your organisation already has Power BI or Tableau set up, we build on top of your existing environment rather than starting from scratch. We'll assess what's already in place before recommending anything additional.
A data warehouse is essentially a centralised store that pulls data from all your different systems into one place. Not every project needs one, if you're working from a single data source, it may not be necessary. But if your data lives across multiple platforms and you're seeing inconsistencies between reports, a warehouse usually solves that problem cleanly.


Visit Our Office
Experience how we bring innovation and technology together to create solutions that drive business success.
Join the AI Revolution
Contact us today to discover how we can help your business unlock the full potential of AI.


